Linear Lines
To produce a line on our graph, the easiest solution is using geom_smooth(method=lm). geom_smooth() by default will produce a loess smooth through our graph with confidence intervals. Since we have run a linear model, we specify the method of the geometric shape to fit that of a linear model (lm).
ggplot(tadpoles, aes(x=pondsize, y=abundance)) +
  geom_point(alpha = 0.5)+
  geom_smooth(method=lm)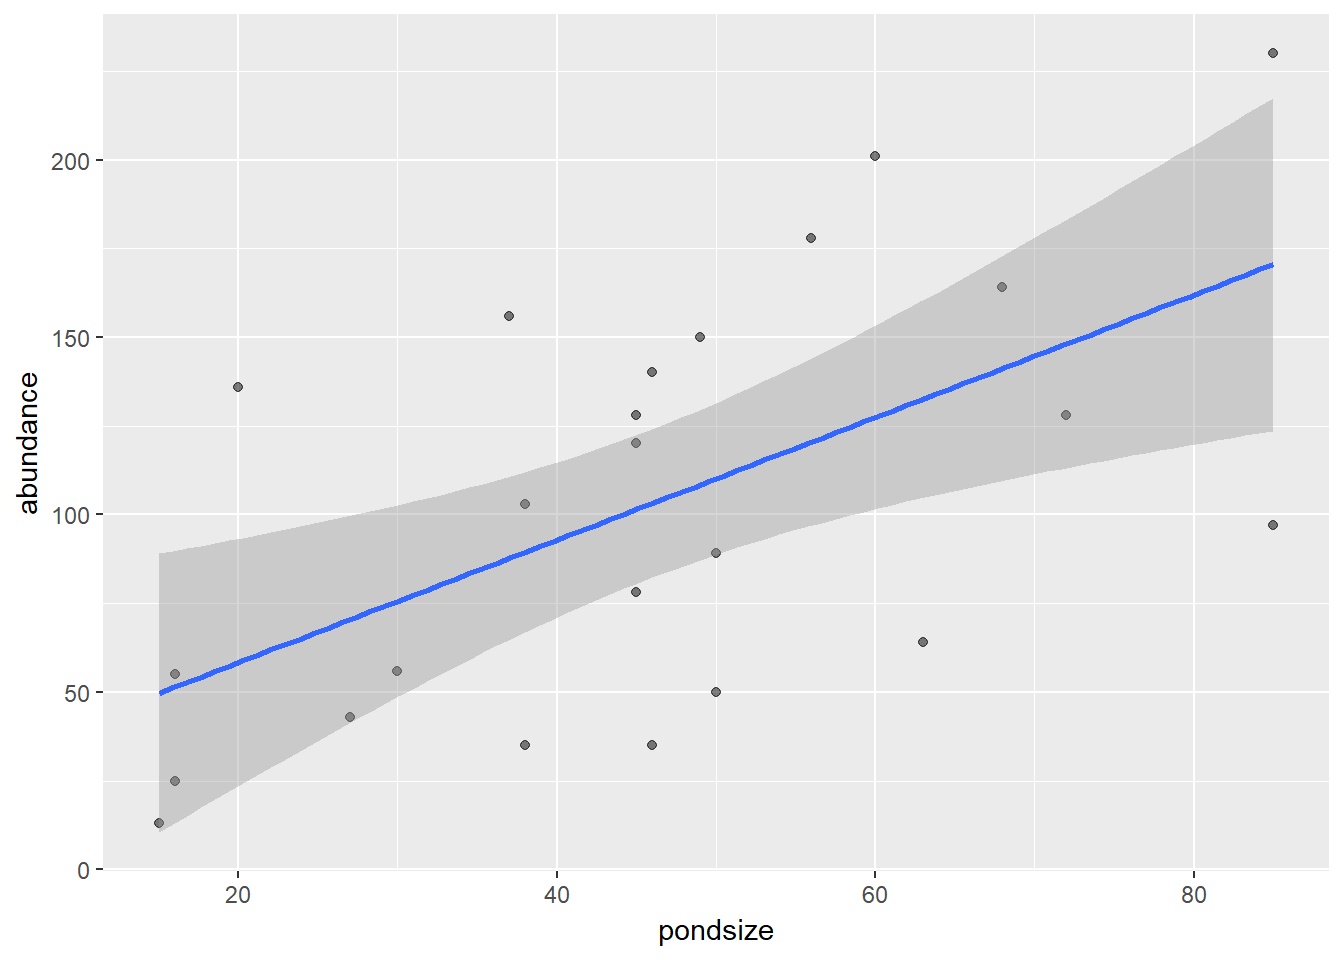
method=lm tells the smooth line to plot a linear relationship between the variables in the graph environment. You will see it automatically plots confidence intervals and colours the line blue. By default it will only extend to the range of our data, which is good. Both of these can be changed with the following:
ggplot(tadpoles, aes(x=pondsize, y=abundance)) +
  geom_point(alpha = 0.5)+
  geom_smooth(method=lm, se = FALSE, fullrange = TRUE)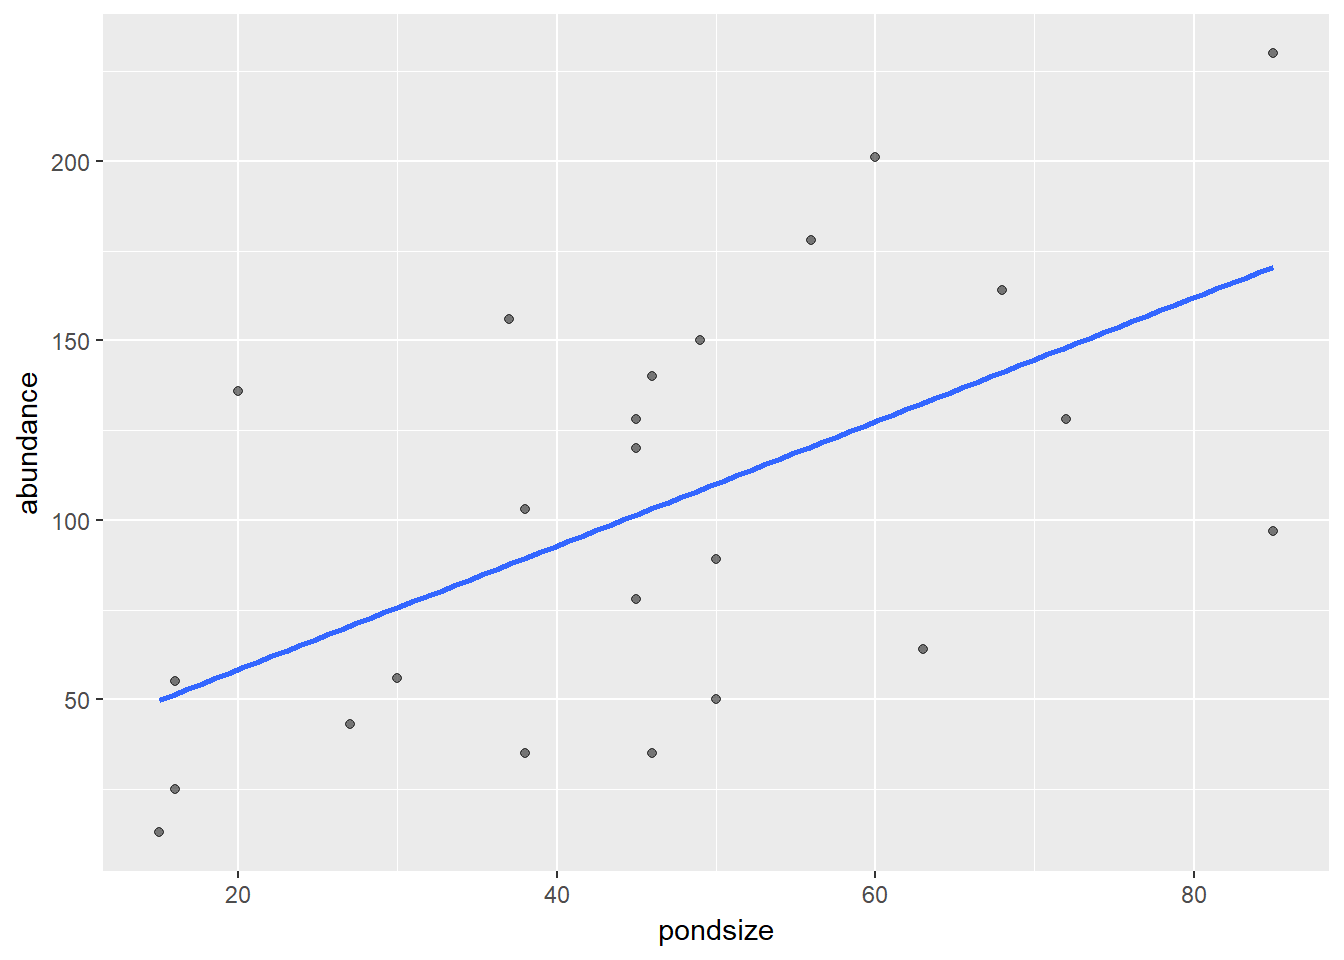
se = FALSE will turn off the standard error/confidence intervals for the line. This is set to true by default.
fullrange = TRUE will extrapolate the line to the fullrange of the x & y axes. This should only be used it you are confident in what you are doing, as it does extrapolate data outside of what you collected.
Colour and line type
Colouring the the line follows the same principles as points and bars. colour = will colour the line itself, while fill = will colour the ribbon/confidence intervals.
ggplot(tadpoles, aes(x=pondsize, y=abundance)) +
  geom_point(alpha = 0.5)+
  geom_smooth(method=lm, colour = "red", fill = "mediumpurple1")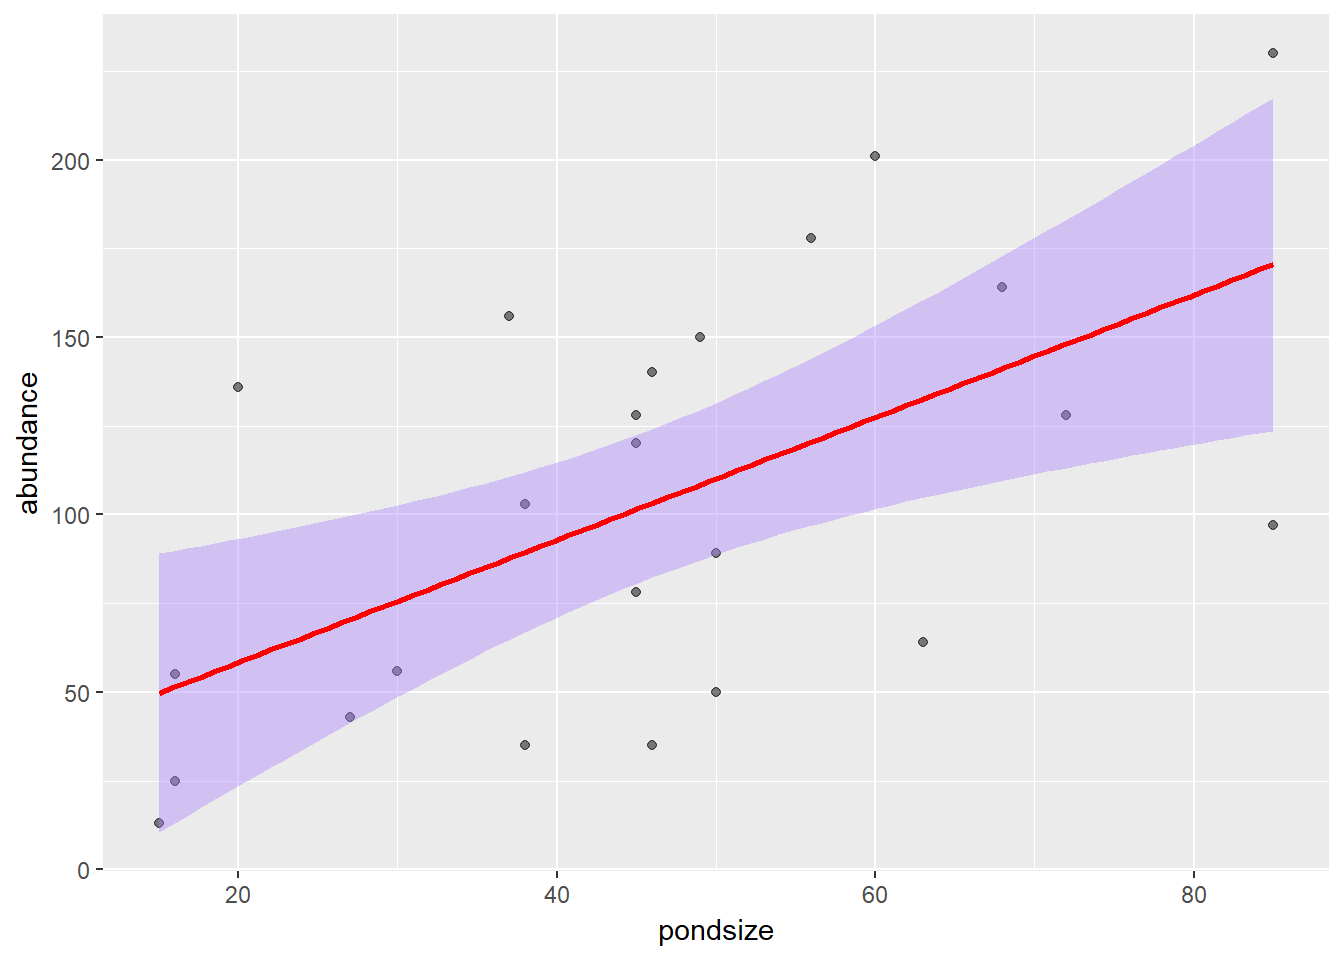
We can also change the line type using linetype = and specifying one of the 6 line types.
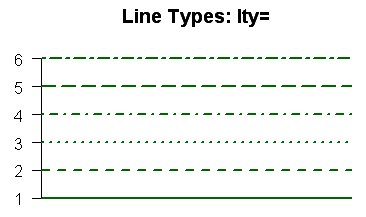
ggplot(tadpoles, aes(x=pondsize, y=abundance)) +
  geom_point(alpha = 0.5)+
  geom_smooth(method=lm, colour = "red", linetype = 2)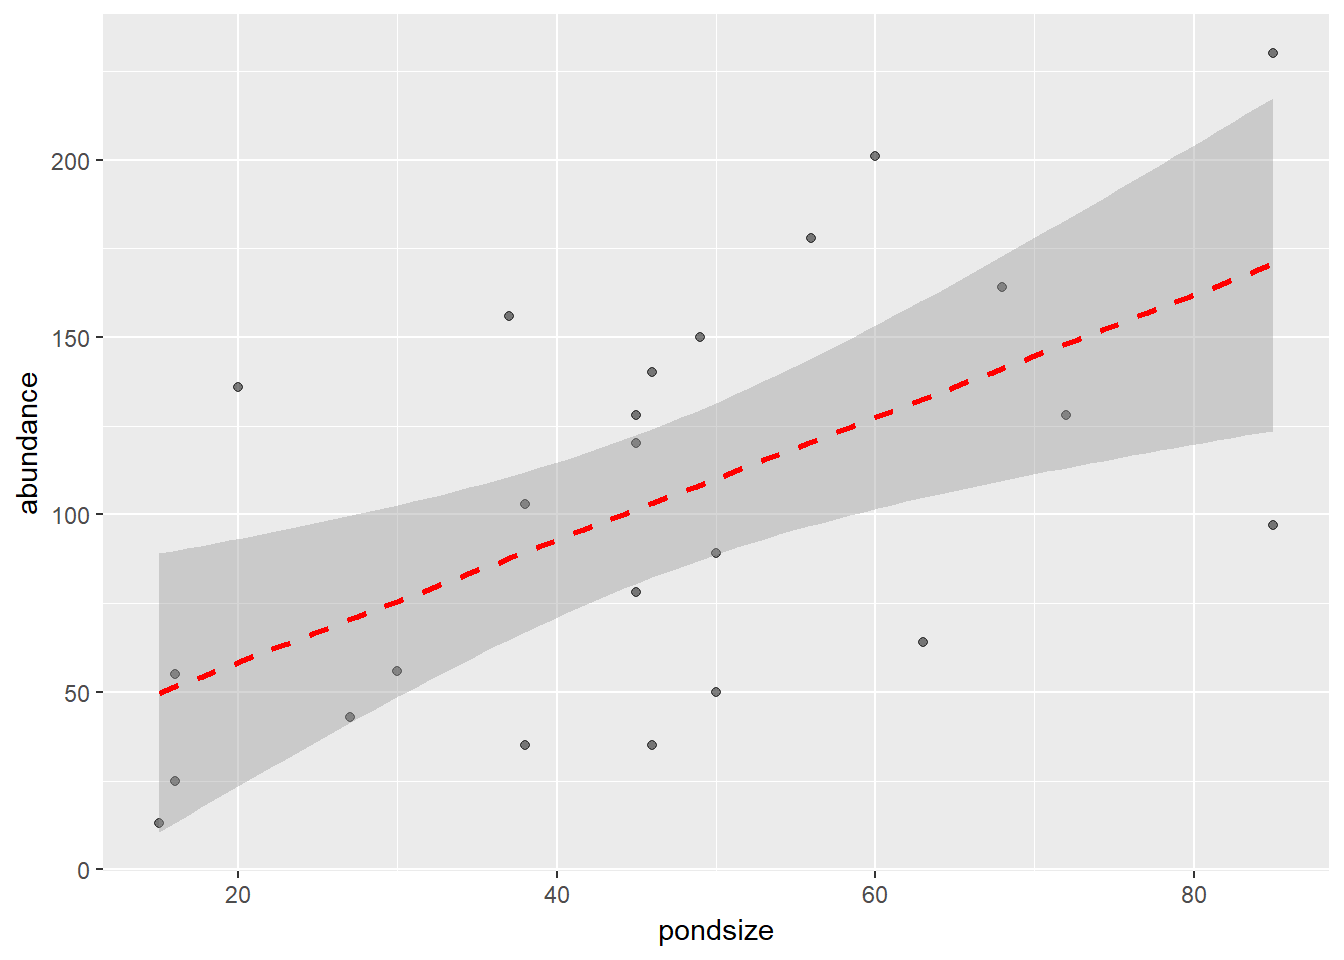
Multiple Lines
We can also plot multiple lines using the colour argument within the aesthetics (aes) of our graph and colour by a factor.
ggplot(tadpoles, aes(x=pondsize, y=abundance, colour = reeds)) +
  geom_point(alpha = 0.5)+
geom_smooth(method=lm) 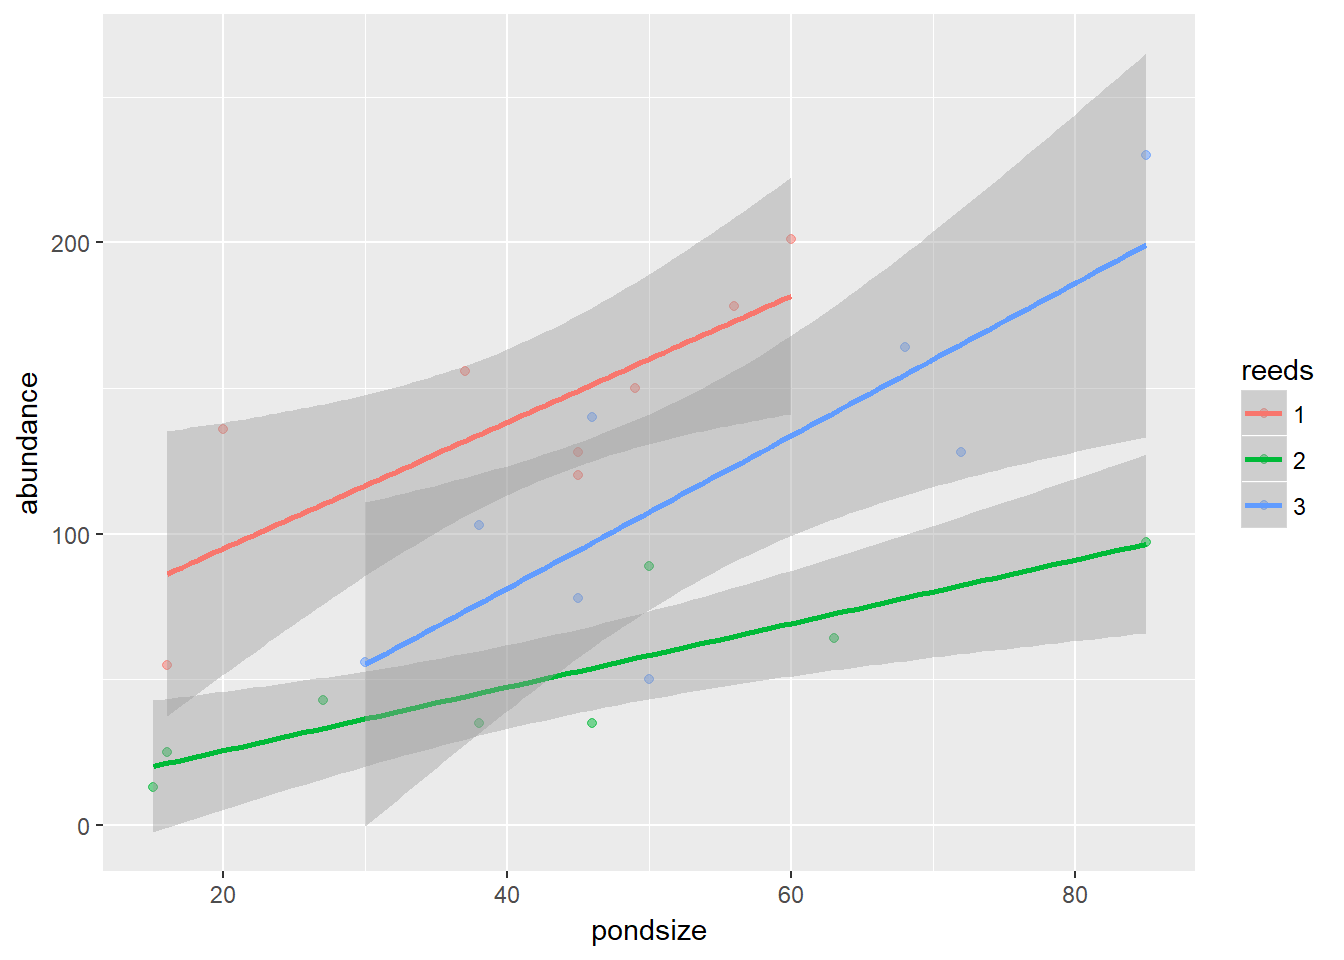
This time, we plot three lines by using the reeds factor. You can change the colouring and shape of each of the lines using the same commands as with points and bars.
You dont need to specify the aesthetic variables in the ggplot command, you can do so in each separate geom line by using aes(). This means you can produce three lines using colour in geom_smooth, but keep the points normal in geom_point. This is the same across all ggplot graphs
This is an example of that point.
ggplot(tadpoles) +
geom_point(aes(x=pondsize, y=abundance))+
geom_smooth(aes(x=pondsize, y=abundance, colour = reeds), method=lm) 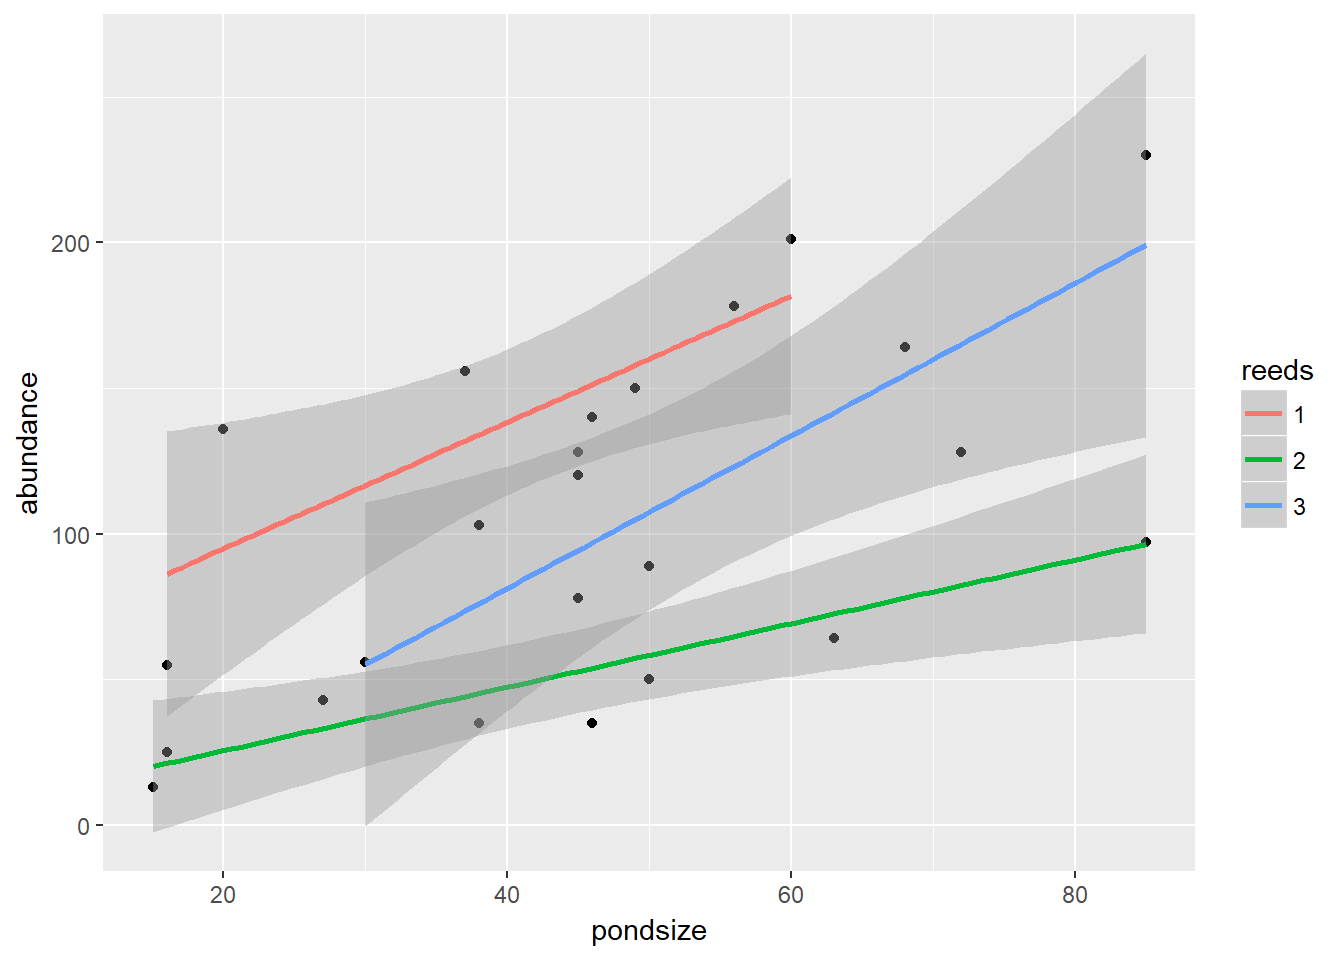 You can see in this example, that the points are black, while the three lines are coloured by reeds.