R Studio & Coding Environment
Introduction
This module will provide an introduction into the R statisitical environment, going through the basics of data analysis and graphing for publication quality results. By the end of this module, you should be able to:
- Understand and use the R studio working environment
- Import and manipulate data files
- Undertake linear (ANOVA, regression) and generalised linear (logistic regression) models and associated assumptions/comparisons
- Undertake basic multivariate techniques (PCA, MDS)
- Construct bar plots and scatterplots in ggplot
What is R?
R is a language and environment for statistical computing and graphics. R is free/open source software and as a result, has a community of dedicated statisticans, coders and developers increasing the capabilities and usability of the platform. R primarily runs as a command-line program.
This is a big entry barrier to many starting to learn R, so most people have turned to “R Studio”.
Base R
Why R?
Since R is free and open source, it is a program and skill that can be carried with you across many institutions and jobs and is for many, the single solution for statistical analysis, graphing and even GIS/spatial analysis. Programs like JMP, SPSS and ARCGIS cost 100s if not 1000s of dollars and are quickly outdated by new versions.
However, the biggest uses of R come from its sharability and openness. Collaborating and sharing data analysis with R requires only the script and raw data. All data manipulations are done within R, requiring no editing or manipulating of your raw excel data.
R Studio
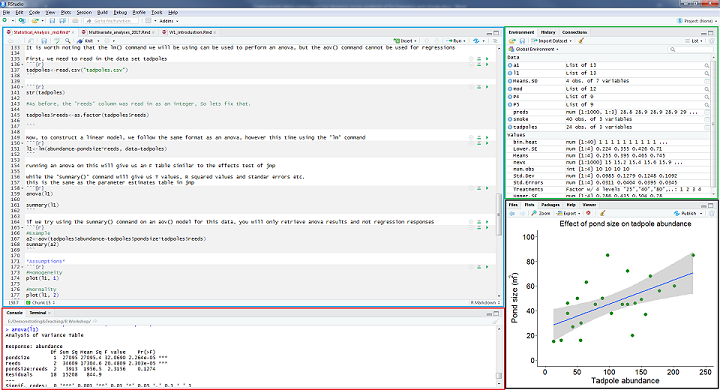
The R Studio Environment
R studio “reskins” the standard R environment, giving space for script writing, help, graphics output and tracking of data files. Due to the ease of working in R studio, thats what we will be using. R studio can provide an array of functions from statistical analysis and graphing, GIS/spatial analysis, presentations, document preparation (all of these tutorials are written in R) and even novel functions like interacive graphs and tweeting.
Layout
R studio is separated into 4 panels:
The top-left panel (blue) is the editor (or script window) where you can view and write your R script. This is a saveable document of code. Running code is as simple as Ctrl+Enter on a line of code or pressing the run button in the top-right of this window.
The bottom-left (red) is the console. This is the standard R environment where you can run code directly, or view the output of your script as you run it.
The top-right (green) is your workspace. This lists each “object” as you create them through your analyses. Clicking a data-frame object will allow you to view it.
The bottom-left (black) has lists of files and packages as well as the help window (quickly access by typing ? before any command) and plots which shows any graphical output.
Now we have an idea of what R is, it is time to install R & R Studio onto your computer.
Install Instructions
1. Click Here to visit the R webpage and select one of the Australian mirrors to download (CSIRO, University of Melbourne etc.)
2. Select your version (Windows or Mac), then download the base subdirectory
3. Once installed, visit R studio to download R studio desktop.
Once both of those are installed, you can now proceed to open up Rstudio