Homogeneity of Variance
Homogeneity of variance is the other main assumption we are concerned with when conducting an ANOVA. Homogeneity of variance is the assumption that the variance between groups is relatively even. That is to say, all groups have similar variation between them. Similar to the assumption of normality, there are two ways to test homogeneity, a visual inspection of residuals and a statistical test.
To conduct a visual inspection of the residuals we simply use the following:
plot(weeds.aov, 1) # using plot number 1 this time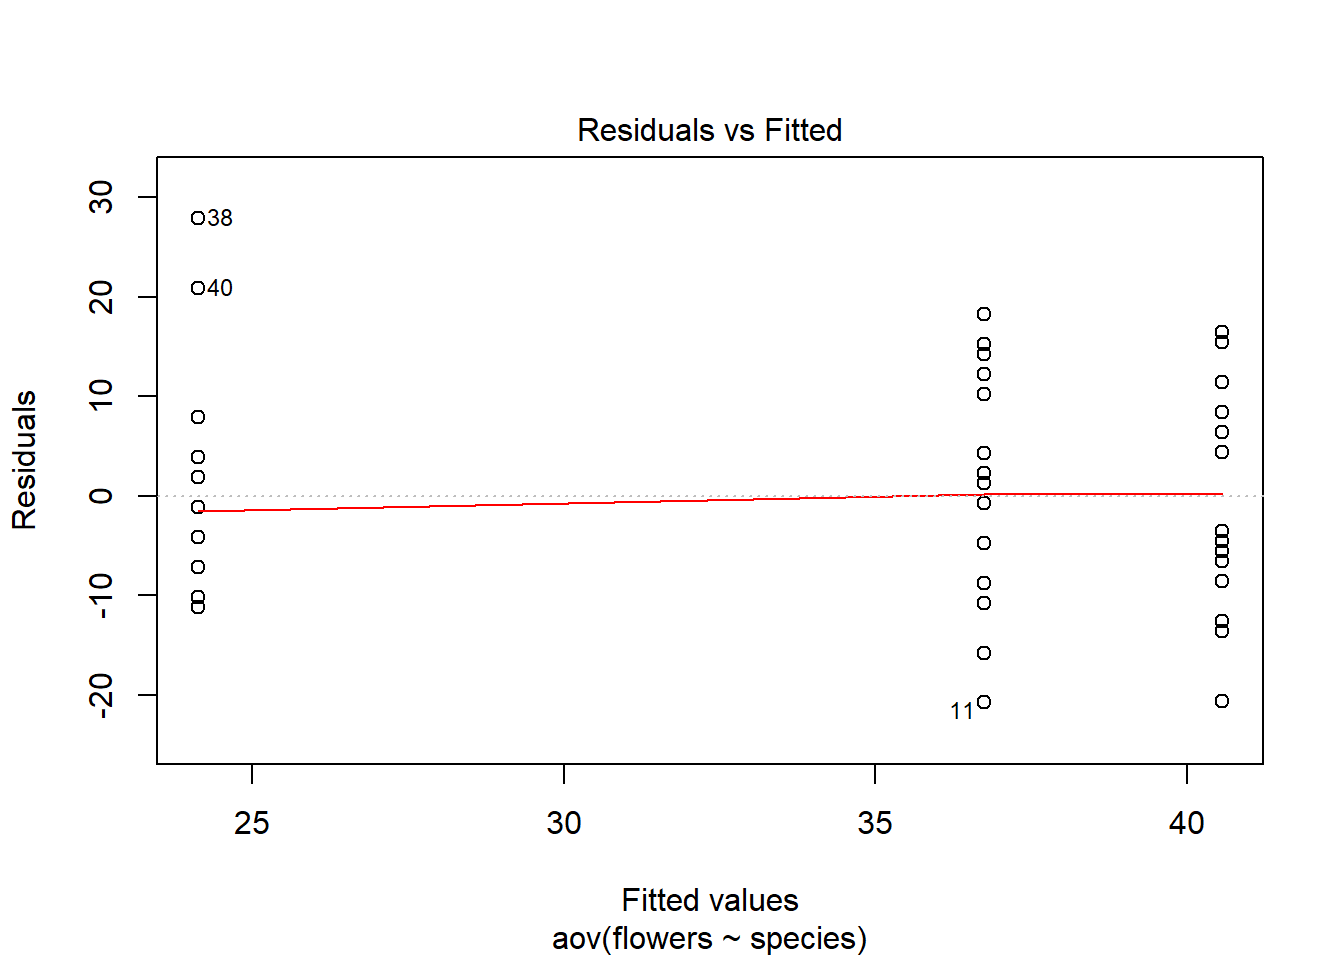
Heterogenous variances are indicated by a non-random pattern in the residuals vs fitted plot. We look for an even spread of residuals along the Y axis for each of the levels in the X axis. We know species contains 3 levels (“Comprosma”, “Oleria” & “Pultenaea”) so we should see three columns of dots, with an even spread along the Y axis.
The other way to test this is to use a statistical test, such as a Cochrans or Bartletts test. For this module, we will be taking a departure from the typical Cochran’s Test as there are other tests that (in my personal opinion) are more useful and WAY easier to conduct in R. The first of these will be a Bartlett’s test.
bartlett.test(flowers ~ species, data = weeds)##
## Bartlett test of homogeneity of variances
##
## data: flowers by species
## Bartlett's K-squared = 0.15957, df = 2, p-value = 0.9233Simple and easy!
This shows us that the variances are homogenous (i.e. a non-significant P value). The reason we may not use a Bartlett’s test all of the time is because it is highly sensitive to departures from normality (i.e. non-normal datasets). If we suspect our data is not-normal or is slightly not-normal and want to test homogeneity of variance anyways, we can use a Levene’s Test to account for this. I suggest reading up on the differences between bartlett’s and levene’s tests before using levene’s. Here is how to do it anyway:
library(car) # install the car package for this test
leveneTest(flowers ~ species, data=weeds)
## Levene's Test for Homogeneity of Variance (center = median)
## Df F value Pr(>F)
## group 2 0.3131 0.7327
## 45Again, simple and easy to use. Our P value is not significant which agrees with the Bartlett’s test result.
What is the bartlett p-value for the species richness by fragment analysis in the Insecticide dataset?
0.1022