Columns
Another important aspect of R coding syntax is refering to specific columns. This is done by using a $ sign after specifying our dataset and then calling the column. Like so:
head(weeds$flowers.m3) # This says to run the head() command but only on the flowers.m3 column## [1] 14 17 23 26 35 45Try this with some of the other commands above. Note: Some of them will not work and will show NULL. This is because these are designed to view aspects of the data frame (e.g. names() )
Now we know how to refer to a column, we can fix any issues with importing incorrect data
Pretend for a moment our data was input incorrectly:
weeds$species<-factor(weeds$species)This would simply save the command factor() on the column species to our weeds object.
If we wanted an ordered factor, e.g. small < medium < large we can use the following
## example dataset ##
sizes <- factor(c("small", "large", "large", "small", "medium", "medium")) # creating a single column factor with 3 levels
sizes
## [1] small large large small medium medium
## Levels: large medium smallHere we have just created a new example dataset which consists of a single column, containing the words: small, large and medium in a random order.
We can order these into a logical order, so R will know that medium is bigger than small and large is bigger than medium
sizes <- ordered(sizes, levels = c("small", "medium", "large")) # ordering levels from small through to large.
# Note: I did not need to specify column as this is a single column dataset.
sizes # Now the factor is ordered.
## [1] small large large small medium medium
## Levels: small < medium < largeWe can then do this with our weeds dataset, ordering them in a nonsensical order.
weeds$species<-ordered(weeds$species, levels=c("Pultenaea", "Olearia", "Coprosma"))This is useful when the dataset you are working with has an ordered factor.
The main use for this is in graphing
By default, R will always sort in alphabetical order, which can be a pain when graphing. If you want ordered factors, or want to present factors along an X axis in a more logical order then the ordered() command or even factor() command where you specify levels is a good option.
I recommend using the factor() command and specifying the levels using the same syntax as the ordered() command unless your factor is truely ordered. This way we just sort the factor the way we want, but are not messing with the way R views our variable (as an ordinal variable rather than a logically ordered factor).
If you want to change something to a continuous (numeric, integer etc.) its a little more complicated, but in general R shouldn’t mess this up too often. A quick google search or ?numeric will help answer this.
Once we can reference to specific columns we can do interesting things like plot a quick graph.
plot(weeds$flowers.m3 ~ weeds$soil) # This says to plot a graph with flowers.m3 by (~) soil. 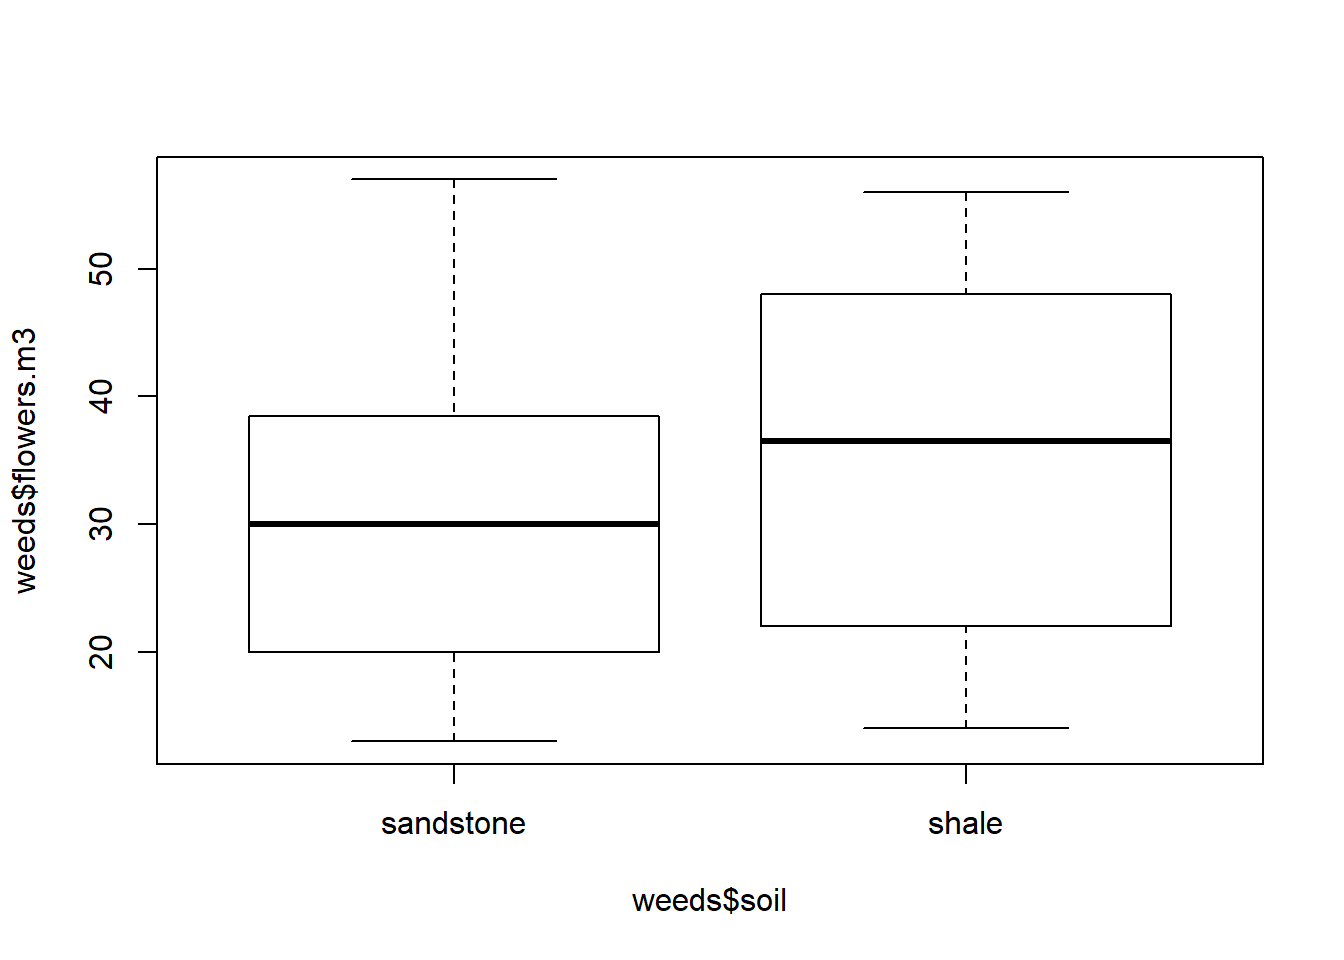
# You should get a box and whisker plot.

hist(weeds$flowers.m3) # hist() is a command that only works on numeric (continuous) columns, and will show you a histogram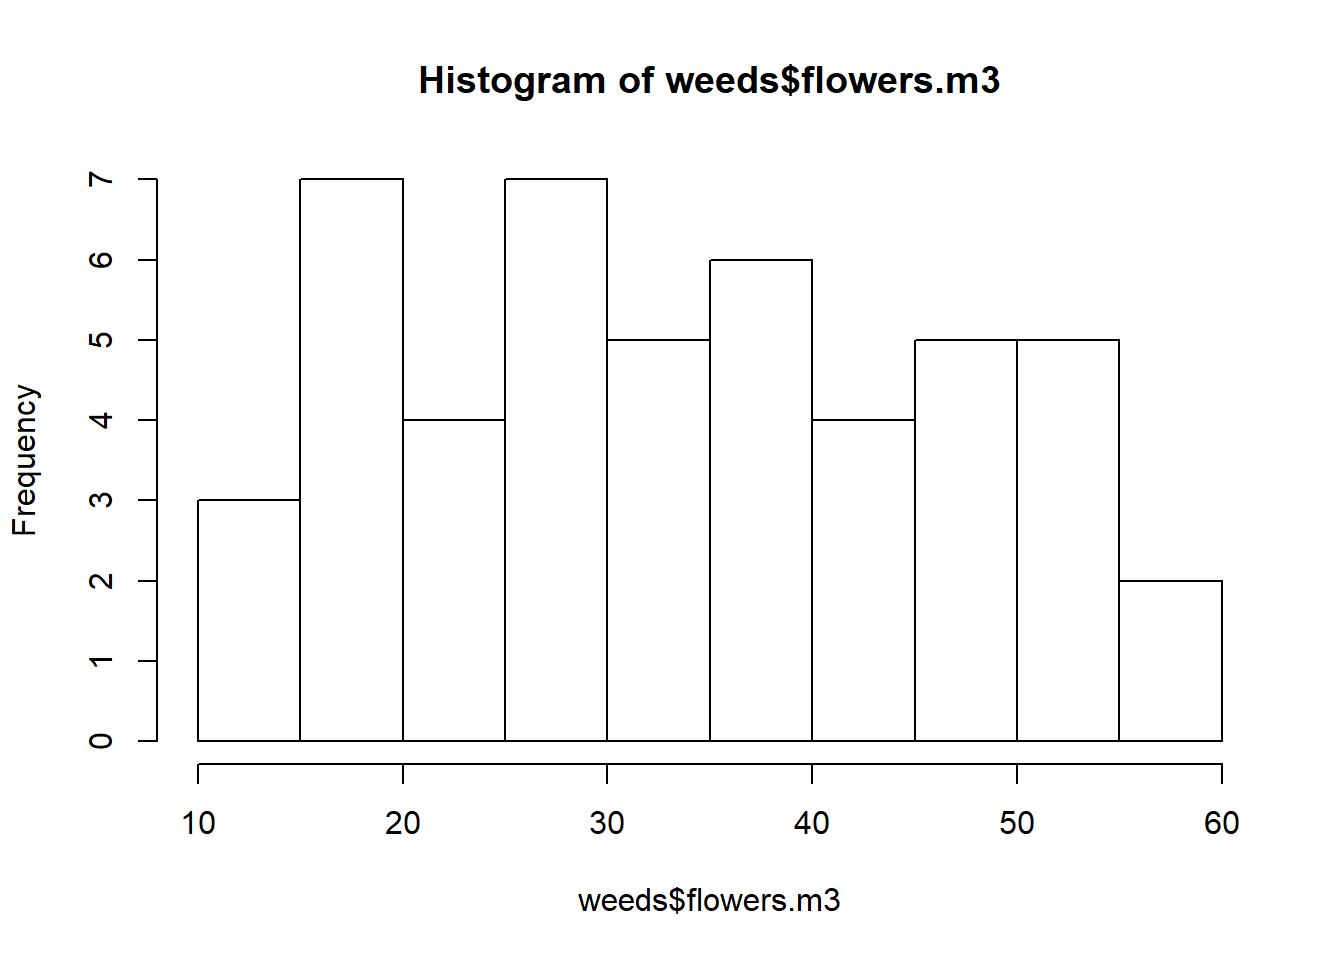
Try replacing the column names in the plot() command to see what types of graphs you get. We will return to graphing at a later date, but this is a quick and easy way to view your data.
Using the plot() command with the insecticide dataset answer the following question:
Question: What fragment size has a species richness outlier? (according to the box & whisker plot)