Axis labels
If we want to change the axis labels themselves, this is done using the labs() command.
iris.scatter <- iris.scatter + labs(x = "Sepal Length (cm)", y = "Petal Length (cm)")

iris.scatter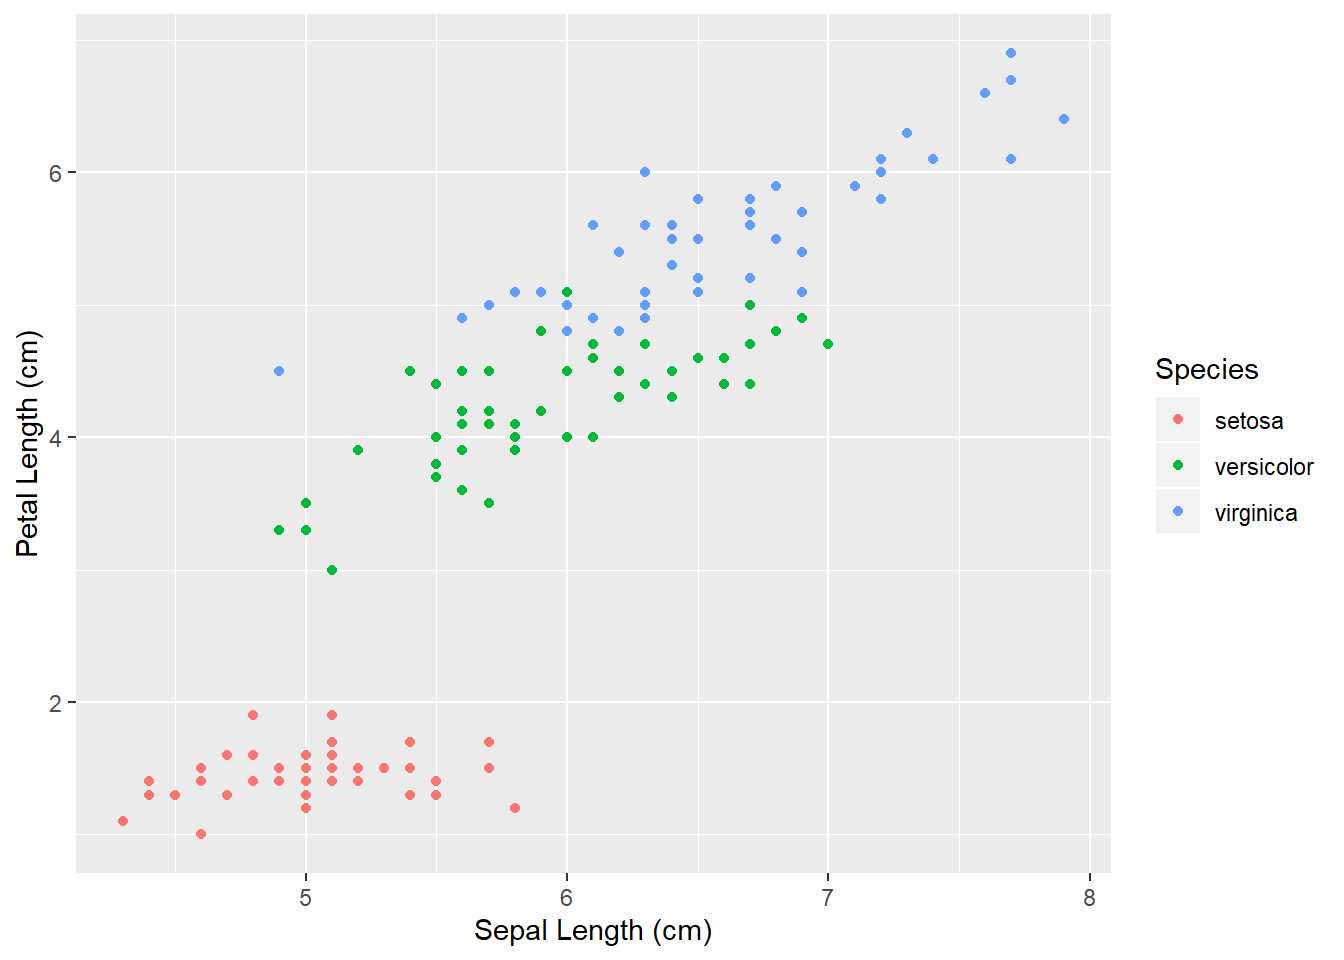
If we wish to add a title to our plot (not overly common in publications) we can use the following.
iris.scatter <- iris.scatter + labs(title= "Relationship between petal and sepal length")

iris.scatter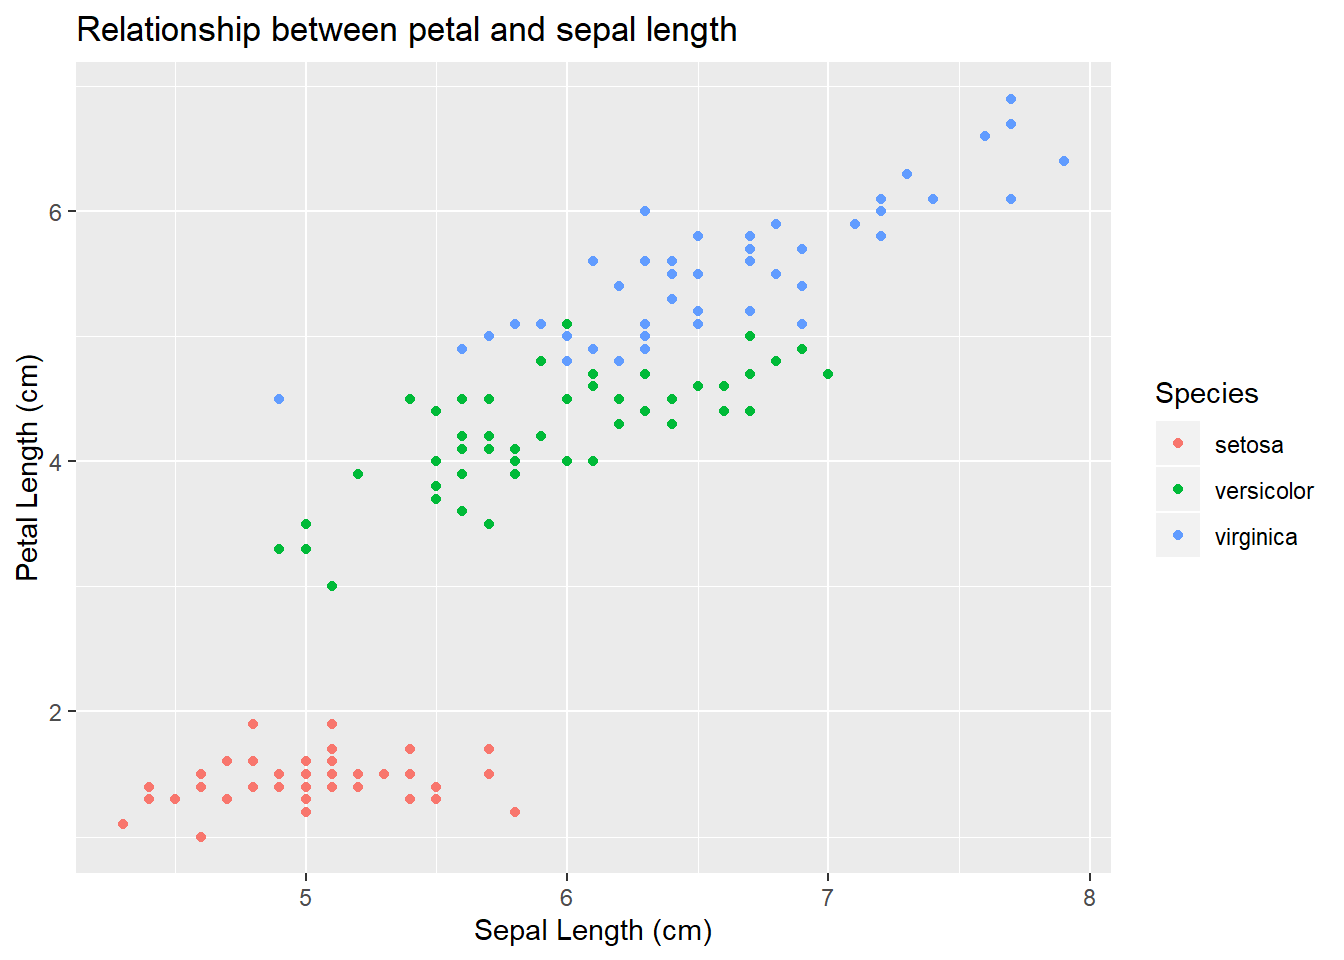
After trying to use these labs() commands you will start to realise it hates anything slightly symbolic (subscript, superscript, degrees etc.). To fix this is simple, but clumsy in how its executed. The following code uses the expression() argument to solve these issues.
I have written a x-axis label that does not make sense, in an effort to display the most common issues. These are a few of my own, so they do not make any sense with the given graph.
iris.scatter <- ggplot(iris, aes(x=Sepal.Length, y=Petal.Length, colour=Species)) +
  geom_point() +
  labs(x = expression(Sepal~Length[cm]), y = expression(Petal~Length^cm))+
  labs(title = expression(Sepal~by~Petal~at~"20"*degree*C))
iris.scatter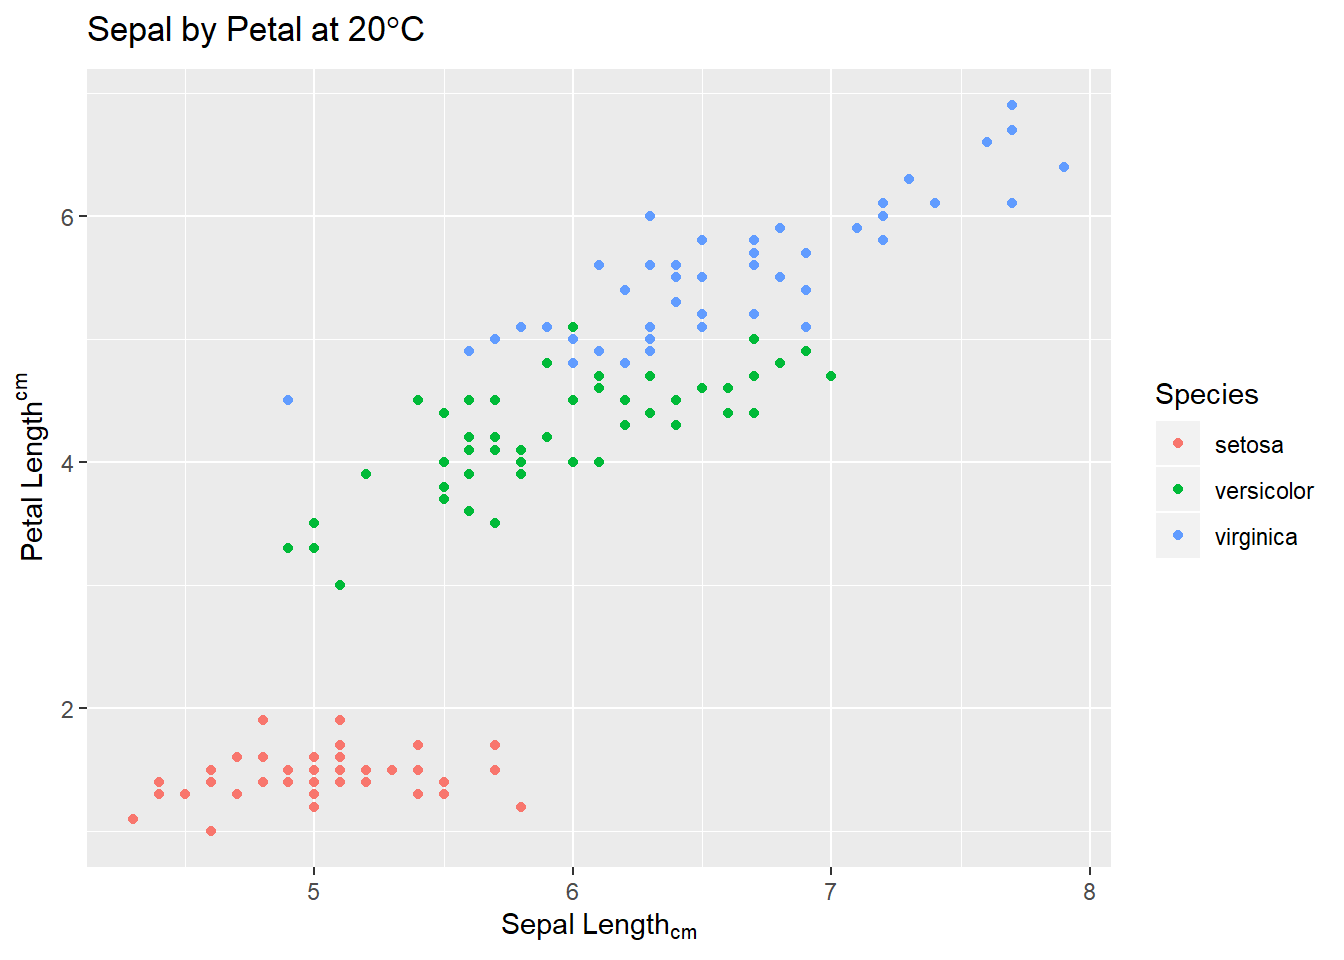
This example, while nonsensical, demonstrates some of the major quirks with the expression() argument/command.
Across all of the expression arguments, we specify a space between characters/words by using a tilde ~. In our x axis, we specify a subscript (lower) by using square brackets []. Anything inside these will be placed below the preceeding character. Similarly, we specify superscript by using the caret ^ to denote power. Anything placed after will be placed above the preceeding character.
In the title line, (note that I had to place the title on a separate line…ggplot is precious sometimes) we see quotations around the 20. This is because expression does not appreciate anything starting with a number. The next thing is the use of both “degree” and the asterix __*__. The asterix is used when we need to write something like “degree” or “pi” to specify a symbol, but when we want it to be next to something, like a C for degree*C.
I hope this helps understand the clumsy execution of complex axis labels.