Proper examples
## Setting up the graph environment ##
iris.scatter.proper <- ggplot(iris, aes(x=Sepal.Length, y=Petal.Length, colour=Species, shape=Species)) + geom_point()
## Making our theme ##
plottheme <- theme(panel.background = element_rect(fill="ghostwhite"),
legend.background = element_blank(),
legend.key = element_rect(fill="ghostwhite"),
axis.line = element_line(colour="black", size=1),
axis.ticks = element_blank(),
axis.title = element_text(colour="royalblue3", size=14),
plot.title = element_text(face="bold", colour="steelblue4", size=16),
legend.title = element_text(colour="royalblue3", size=14),
legend.text = element_text(face="italic", colour="steelblue4", size=10),
axis.text = element_text(colour="steelblue4", size=12),
panel.grid.major = element_line(colour="gray80"),
panel.grid.minor = element_blank())
## Applying the theme, adding some labels and changing some colours ##
iris.scatter.proper <- iris.scatter.proper + plottheme +
labs(x="Sepal Length (cm)", y="Petal Length (cm)", title="Relationship between Sepal Length and Petal Length") +
scale_colour_manual(values = c("mediumorchid1", "mediumorchid3", "mediumorchid4"))
## Displaying our graph ##
iris.scatter.proper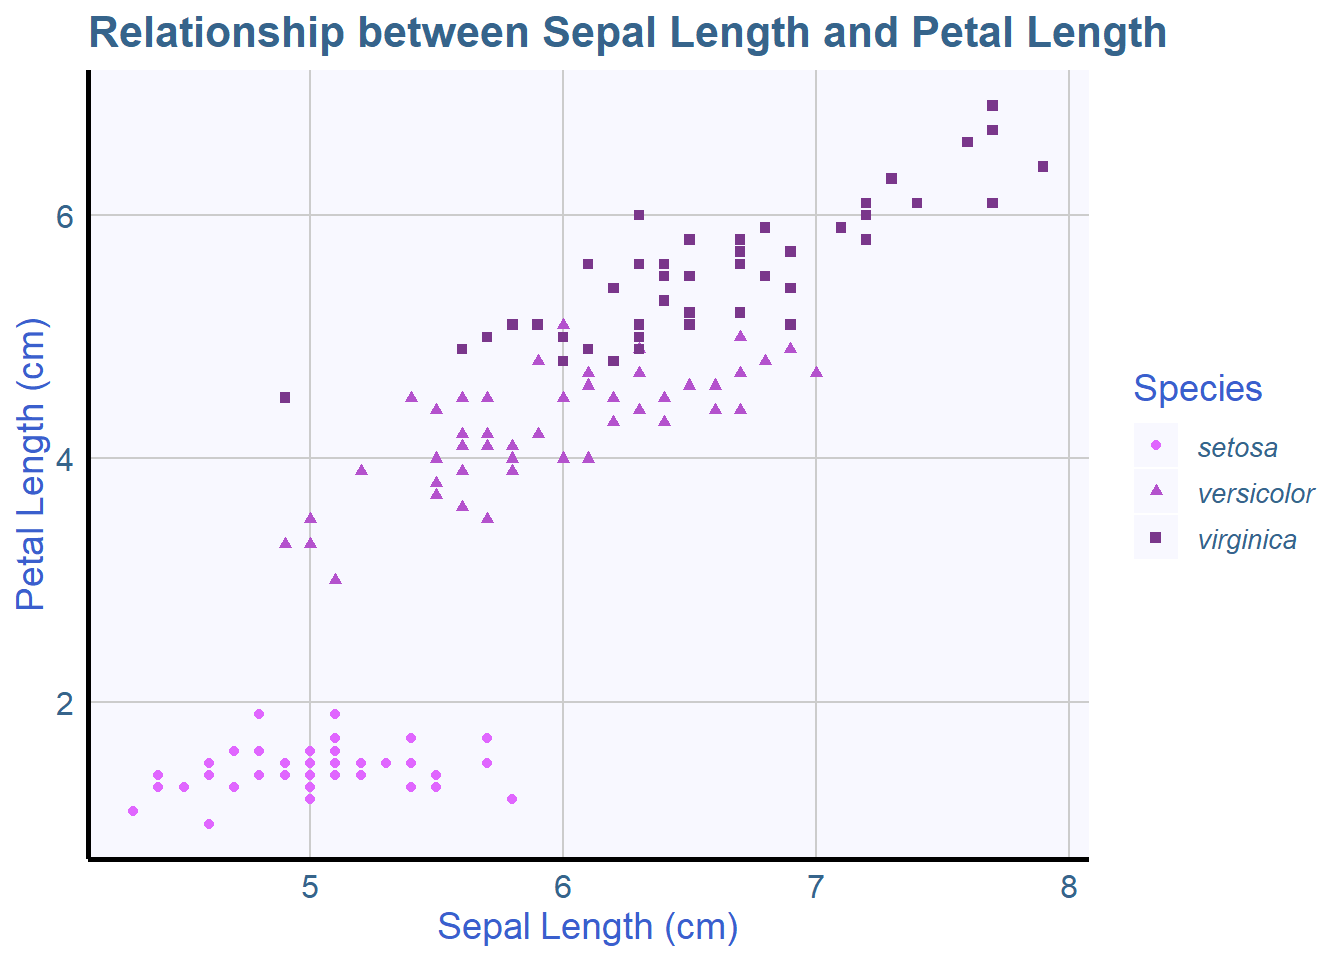 Pretty cool example of changing things around for the “better”. You might notice a few extra things I have changed in this graph.
In the aes() section at the start, I introduced the shape command which changes the shape for each level of a factor. Doing this alongside colour= allows us to change the colour and symbol of the points themselves.
Further down, I then changed the colour of the points using scale_colour_manual() and adding the colour values for the levels in order. There are many different ways you can do this, but I find this works the best. There are scale_manual commands for fill, group, shape etc.
In the theme() section, I covered most things we have done so far but added an additional argument to legend.text and plot.title. This is the face argument which allows us to add italics, bold or others to our text.