Normality
Normality can be tested in two basic ways. Through visual inspection of residuals in a normal quantile (QQ) plot and histogram, OR, through a mathematical test such as a shapiro-wilks test.
To produce the two graphs for visual inspection of residuals we use the following commands:
plot(weeds.aov, 2) # Normal quantile plot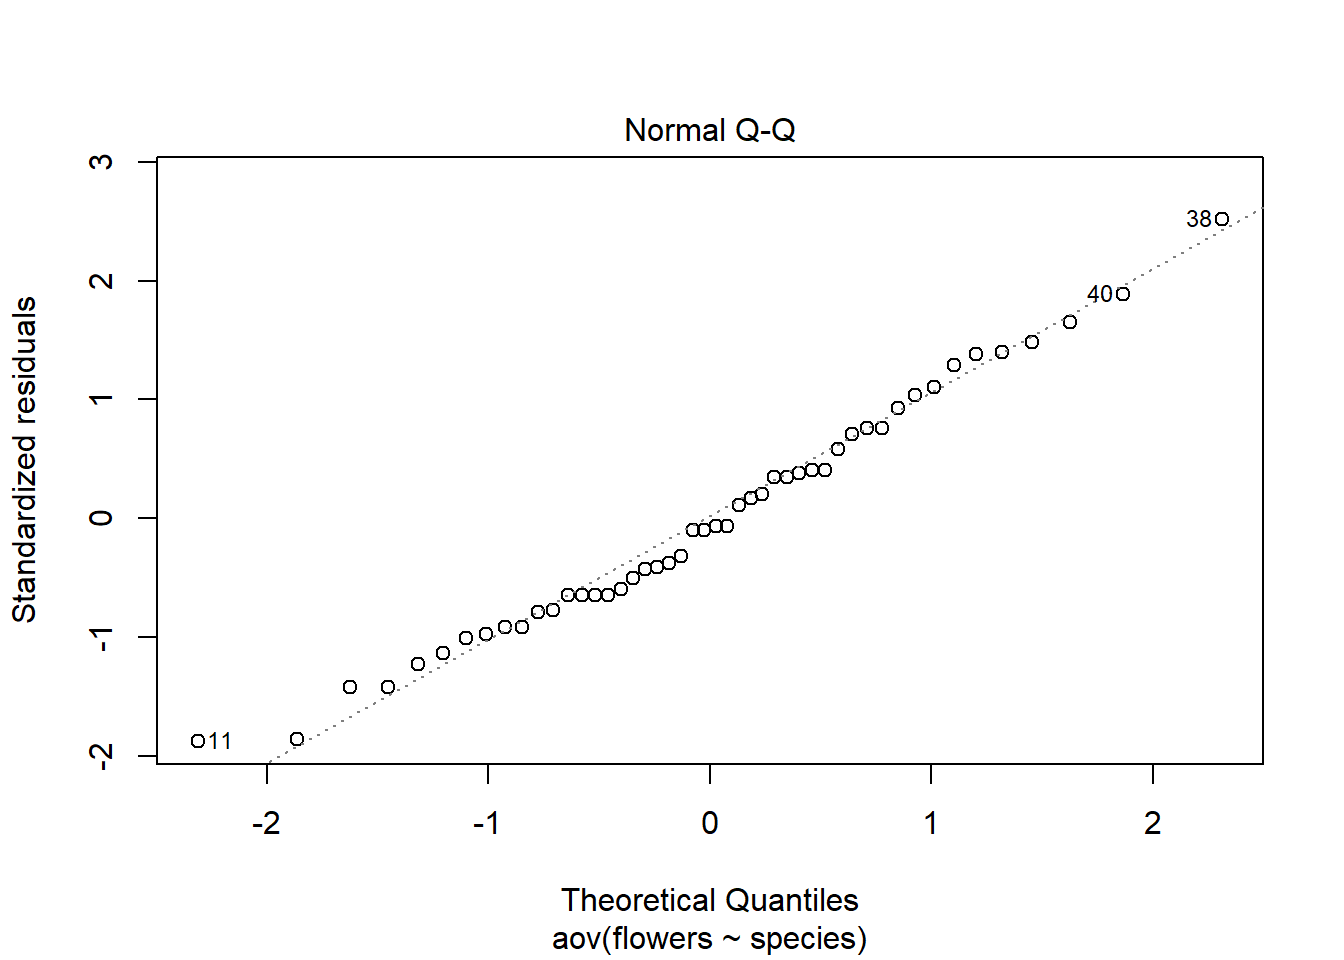
The normal qq plot should display the residuals along the dotted line in a straight manner. In this example, it is pretty straight :)
Plotting the aov() object will generate 4 plots. The QQ plot is the second, so we can just specify the second one to avoid the other 3.
Try removing the 2 and comma and see what the plot command does on its own. It does this because it is being applied to a statistical object (i.e. aov() ).
The plot command (without specifying 1-4) may require you to press “ENTER” in the console for each plot. Make sure to look in the console after running this command
We can also produce a histogram of the residuals:
hist(weeds.aov$residuals) # Histogram of residuals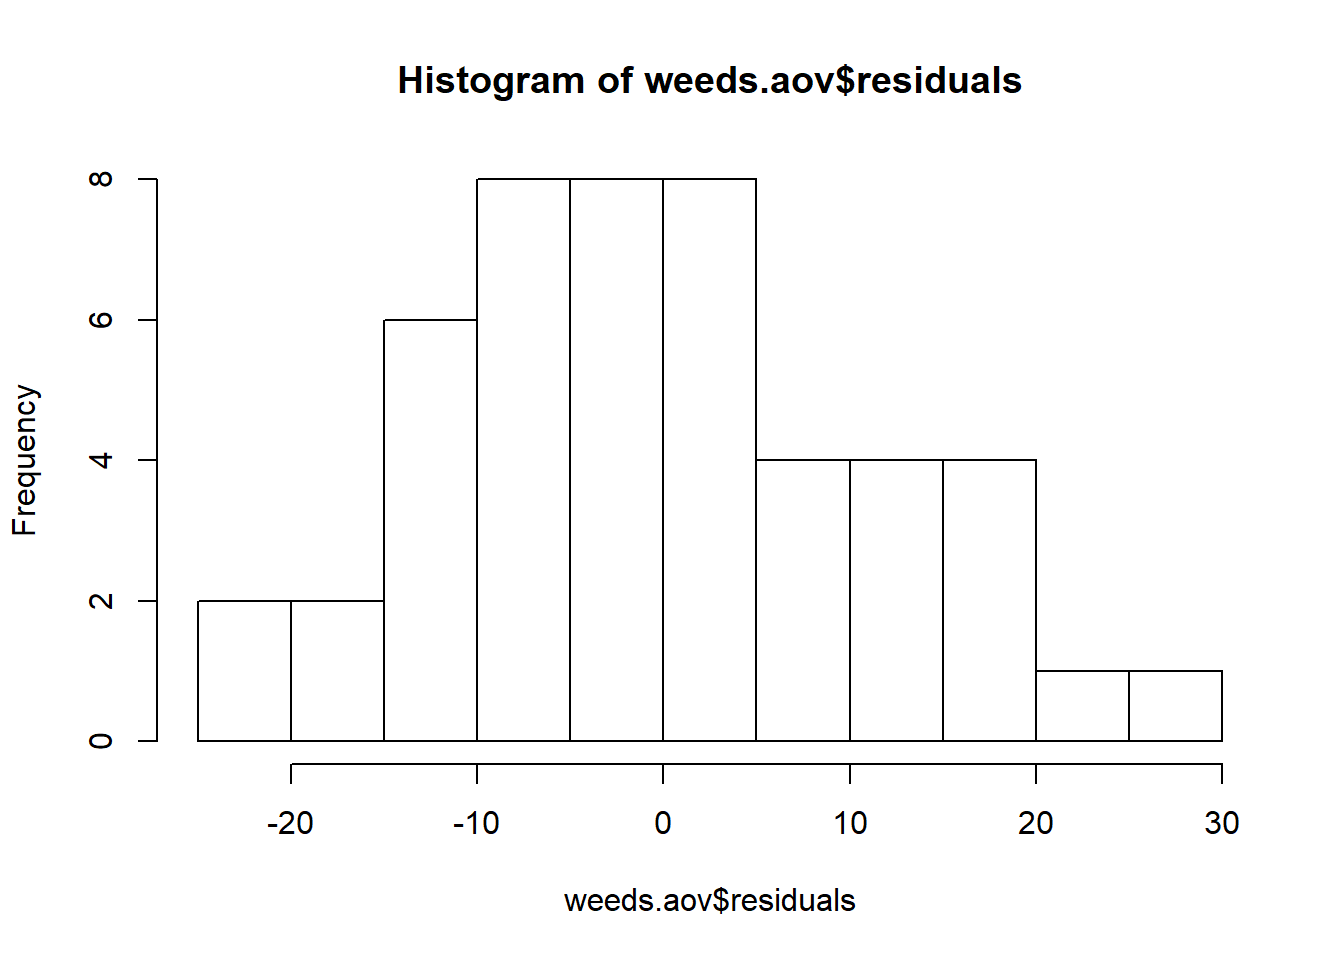
To produce a histogram of the residuals, we simply need to specify the residuals column of our aov() object. Simple!
The reason this works is because the aov() object contains its own column for residuals (amongst other things). Try running str() on weeds.aov to see what columns it contains. The second one should be the residuals.
Something “fun” to do, is to combine both of the graphs in the same window. This produces the same style of output we would get in JMP.
## This may not work in a default notebook ##

par(mfrow = c(1,2)) # This code put two plots in the same window
hist(weeds.aov$residuals)
plot(weeds.aov, 2)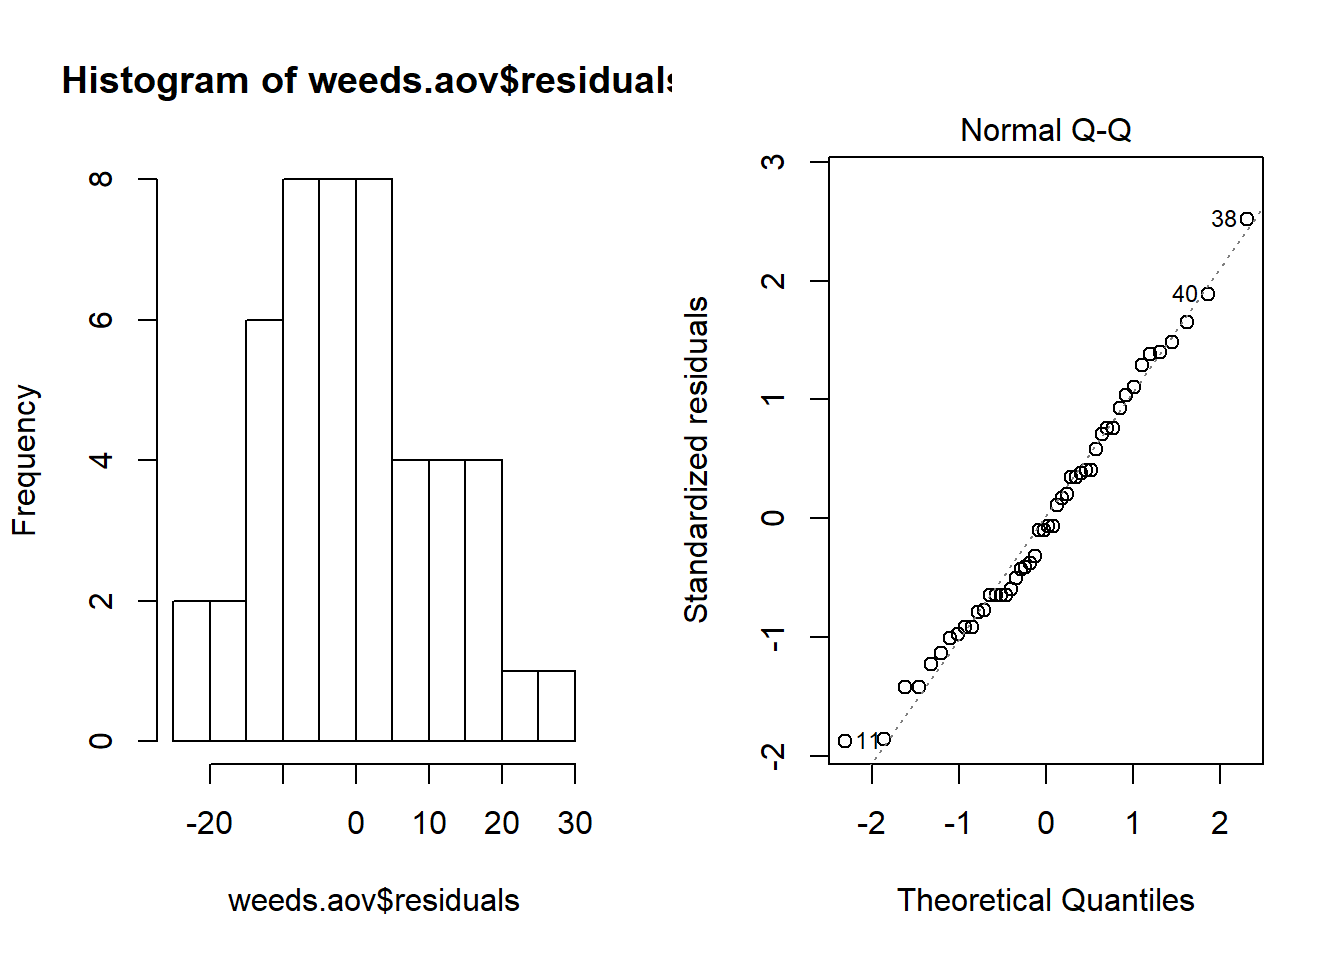
If your using a notebook, the par() command wont work. Click the settings cog and select “chunk output in console”.
If your future graphs keep using this two plot window, use the following command in the console to stop it.
dev.off()
Running a shapiro-wilks test is a similar story. To produce a shapiro-wilks test requires the following code:
shapiro.test(weeds.aov$residuals) # run a shapiro-wilks test on the residuals column of our anova object using the shapiro.test() function##
## Shapiro-Wilk normality test
##
## data: weeds.aov$residuals
## W = 0.98282, p-value = 0.6993With a shapiro-wilks test, if the result is significant, this means our data is NOT-NORMAL. In our case our data is normal.
You should be aware that the shapiro-wilks test is very sensitive to departures from normality and is often considered a “harsh” test. There are many other options for testing normality through an empirical test. Most people prefer to stick with visual inspections of residuals to avoid this.
What is the shapiro-wilks p-value for an anova of species richness and fragment in the “Insecticide” dataset