Using your notebook efficiently
R notebook/markdown files are a fantastic solution for working with R scripts. Compared to a normal R script it allows room to write in plain text without needing a whole lot of hashtags in front of sentances. For most, this is where the use of R markdown documents ends. However, there are a number of extra uses for markdown documents that may increase your efficiency and skills within the R environment.
One thing you may have noticed so far is all of your output from coding chunks is placed below the code chunk itself. This is useful, particularly for statistical analysis but can be irritating for graphing.
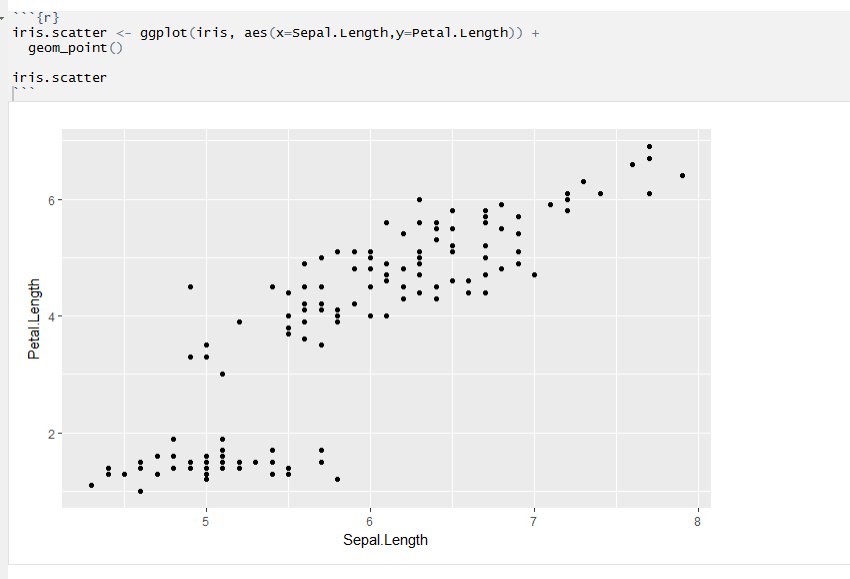
This can be changed so all chunk output is output down in the console and graphs are output in the plot window (same window as packages and help). I personally prefer this as it keeps the script environment cleaner during use.
To do this, simply select the settings gear at the top of your script window (next to knit/preview)
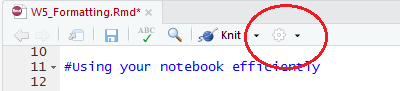
In this dropdown window, select “chunk output in console” to change, or keep it as “chunk output inline” to keep the preview of your output and graphs below the chunks.