Tukeys HSD
All of our analyses so far have showed us that species has an influence on flower abundance. But without conducting an extra test, we cannot be certain which species are statistically significant from each other when it comes to their effect on flower abundance
TukeyHSD(weeds.aov) ## Tukey multiple comparisons of means
## 95% family-wise confidence level
##
## Fit: aov(formula = flowers ~ species, data = weeds)
##
## $species
## diff lwr upr p adj
## Olearia-Coprosma 12.6250 2.84785 22.40215 0.0084638
## Pultenaea-Coprosma 16.4375 6.66035 26.21465 0.0005330
## Pultenaea-Olearia 3.8125 -5.96465 13.58965 0.6149669This is showing us whether the two compared means are significantly different from each other (p adj).
This will give us the print out for the whole analysis. If we want only one factor to be displayed, simply include the which = agument and specify what factor
TukeyHSD(weeds.aov, which = "species") # this will give us only the species column## Tukey multiple comparisons of means
## 95% family-wise confidence level
##
## Fit: aov(formula = flowers ~ species, data = weeds)
##
## $species
## diff lwr upr p adj
## Olearia-Coprosma 12.6250 2.84785 22.40215 0.0084638
## Pultenaea-Coprosma 16.4375 6.66035 26.21465 0.0005330
## Pultenaea-Olearia 3.8125 -5.96465 13.58965 0.6149669While handy and quick, its hard to interpret the print out of this test, particularly in analyses with multi-leveled factors.
The following Tukeys HSD test comes from the package agricolae. I personally only use this package for the Tukeys HSD letter report function.
library(agricolae)
HSD.test(weeds.aov, "species", console=TRUE) # HSD.test() requires you to state the factor, as well as print the output to the console (console=TRUE)
##
## Study: weeds.aov ~ "species"
##
## HSD Test for flowers
##
## Mean Square Error: 130.1931
##
## species, means
##
## flowers std r Min Max
## Coprosma 24.1250 11.13478 16 13 52
## Olearia 36.7500 12.08580 16 16 55
## Pultenaea 40.5625 10.97858 16 20 57
##
## Alpha: 0.05 ; DF Error: 45
## Critical Value of Studentized Range: 3.427507
##
## Minimun Significant Difference: 9.77715
##
## Treatments with the same letter are not significantly different.
##
## flowers groups
## Pultenaea 40.5625 a
## Olearia 36.7500 a
## Coprosma 24.1250 bAs mentioned, this specific Tukey’s function can only do a single specified factor (to my knowledge). These Tukey’s tests are options for single factor significance. For an interaction significance, you will need to consider alternative post-hoc methods.
An interesting method of visualising the interaction term is using the interaction.plot() command. Specifying the three columns you want to see. I find this useful for linear regressions, not so much for categorical data.
interaction.plot(weeds$species, weeds$weeds, weeds$flowers)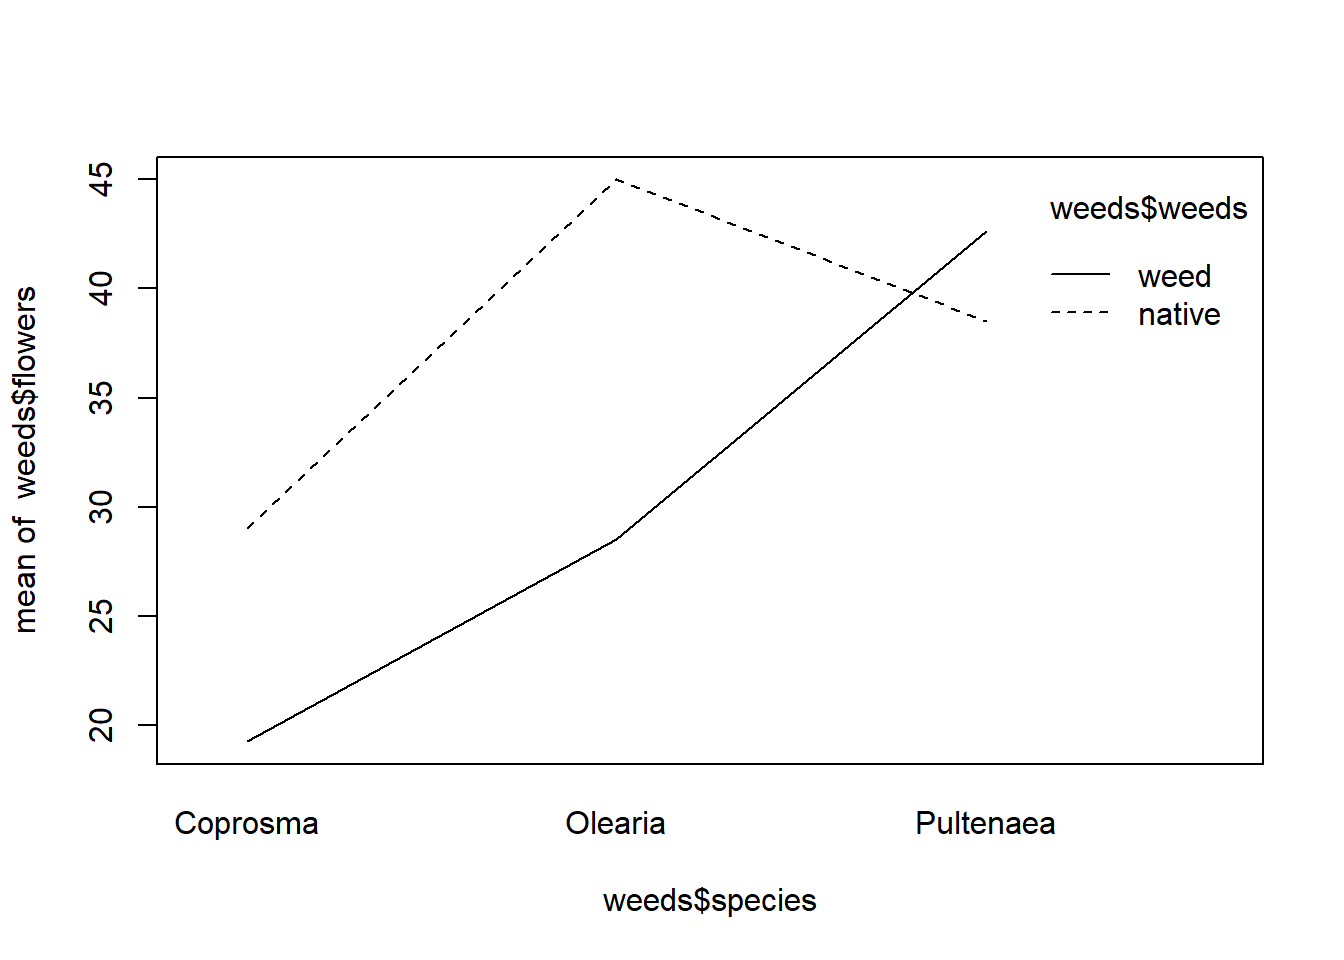
In this example, we see the increase in number of flowers, with a markedly higher increase in native. The significant increase in species is only present in Oleria in native areas.