Grids
So far, our graph does not have the original ggplot grid lines because we removed them in our original graph. Before we start changing these, let’s save our beautiful masterpiece to an object/variable to simplify the theme() changing.
iris.scatter <- iris.scatter + theme(panel.background = element_rect(fill="lavender", colour="red"), legend.background = element_rect(fill="lavender", colour="yellow", size=1), legend.key = element_rect(fill = "gray50", colour = "green", size = 0.5)) +
  theme(axis.line.x = element_line(colour = "skyblue", size=2), axis.line.y = element_line(colour="deeppink", size = 2), axis.title.x = element_text(colour="forestgreen", size=14), axis.title.y = element_text(colour = "gold", size=8), axis.ticks = element_blank())
To change the grid lines on your plot, it is done with the following:
| Theme argument | Description |
|---|---|
| panel.grid.major = element_line(insert changes here) | Changes the major grid lines on the graph. Use .x or .y to change just one. |
| panel.grid.minor = element_line(insert changes here) | Changes the minor grid lines on the graph. Use .x or .y to change just one. |
Again, using the same principals of colour and size for these ones.
iris.scatter + theme(panel.grid.major = element_line(colour="aquamarine", size=1), panel.grid.minor = element_line(colour="slategray2", size=2)) 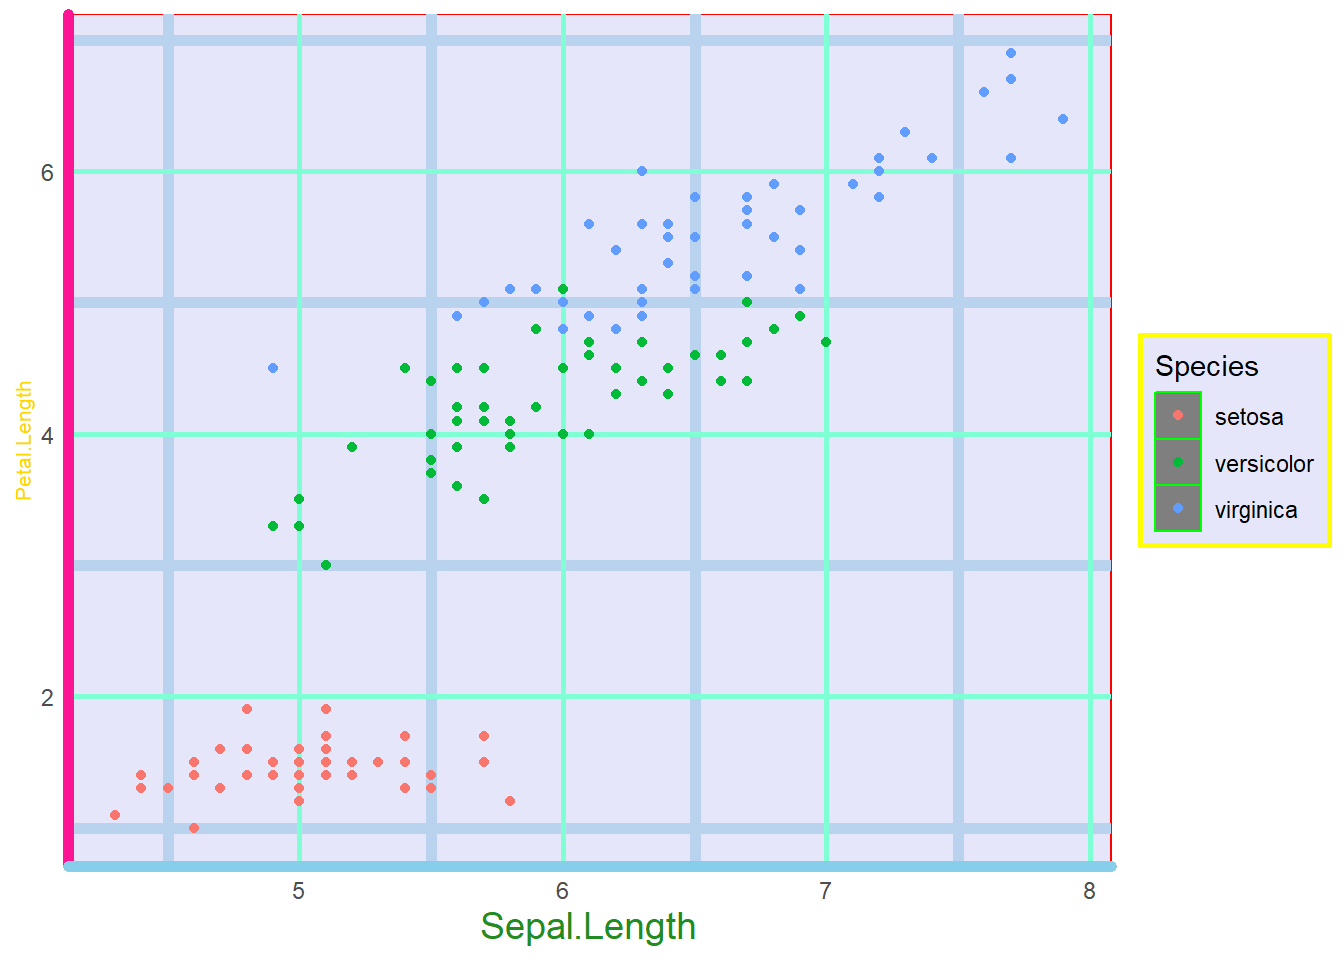 Just like we did before, we can make all of these our own custom theme by directing them to an object.
masterpiece <- theme(panel.background = element_rect(fill="lavender", colour="red"), legend.background = element_rect(fill="lavender", colour="yellow", size=1), legend.key = element_rect(fill = "gray50", colour = "green", size = 0.5), axis.line.x = element_line(colour = "skyblue", size=2), axis.line.y = element_line(colour="deeppink", size = 2), axis.title.x = element_text(colour="forestgreen", size=14), axis.title.y = element_text(colour = "gold", size=8), axis.ticks = element_blank(), panel.grid.major = element_line(colour="aquamarine", size=1), panel.grid.minor = element_line(colour="slategray2", size=2))Now let’s add that to our boxplot.
iris.box + masterpiece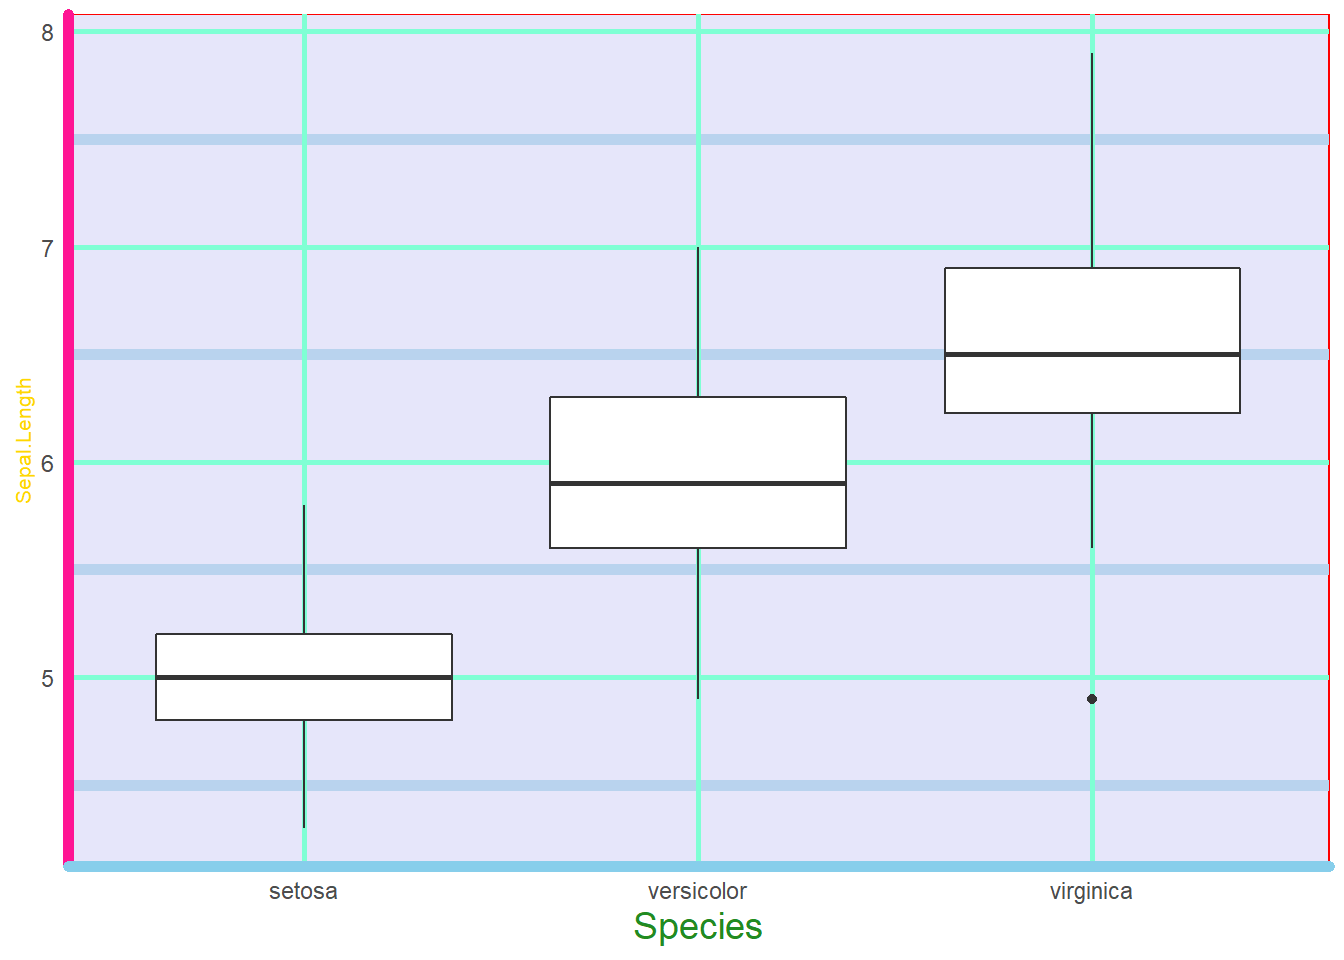 A true work of art!