Themes
The easiest way to quickly modify your graph is to add one of the preset theme() commands. I will add each of them to the graph which will replace the previous theme.
We can simply add items to our current graph object by adding the + sign. Keep in mind that if you dont “resave” it to the object, it wont stick around. If you want to keep a theme, either add it into the original ggplot command, or save it to the same or a new object.
iris.scatter + theme_bw()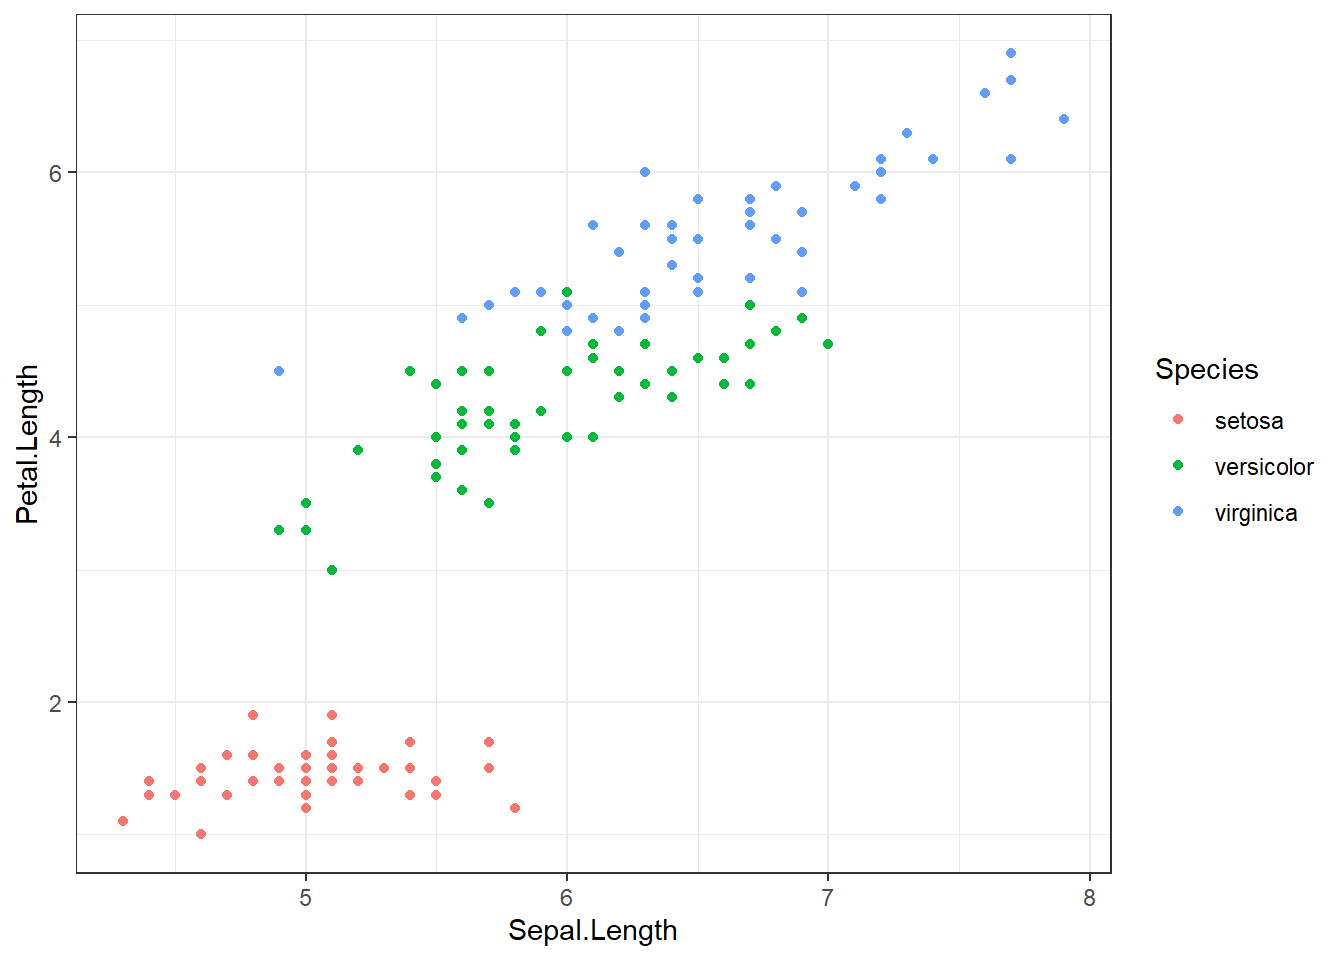
iris.scatter + theme_classic()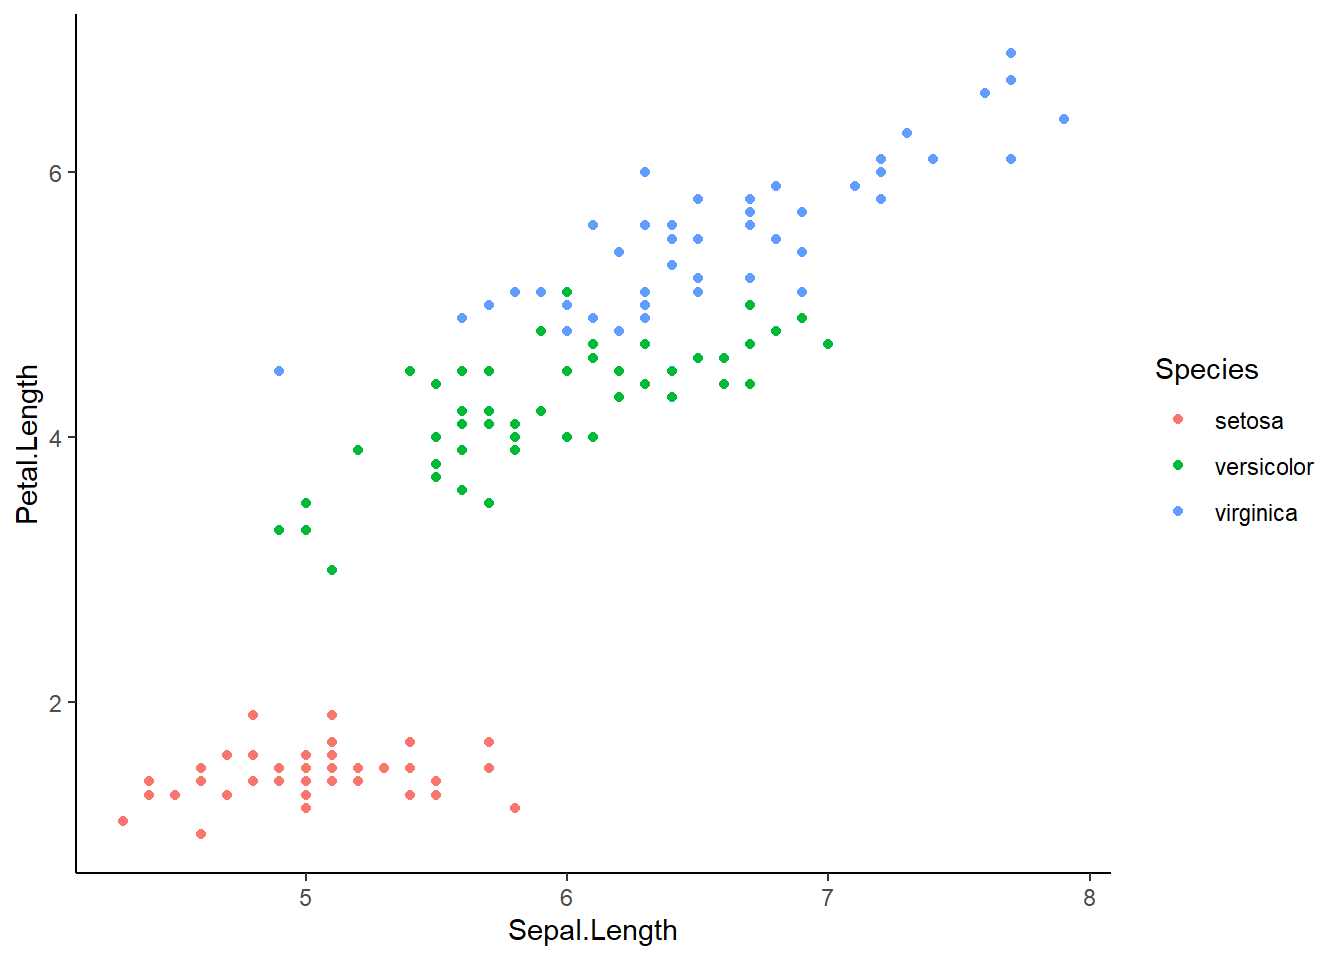
iris.scatter + theme_dark() 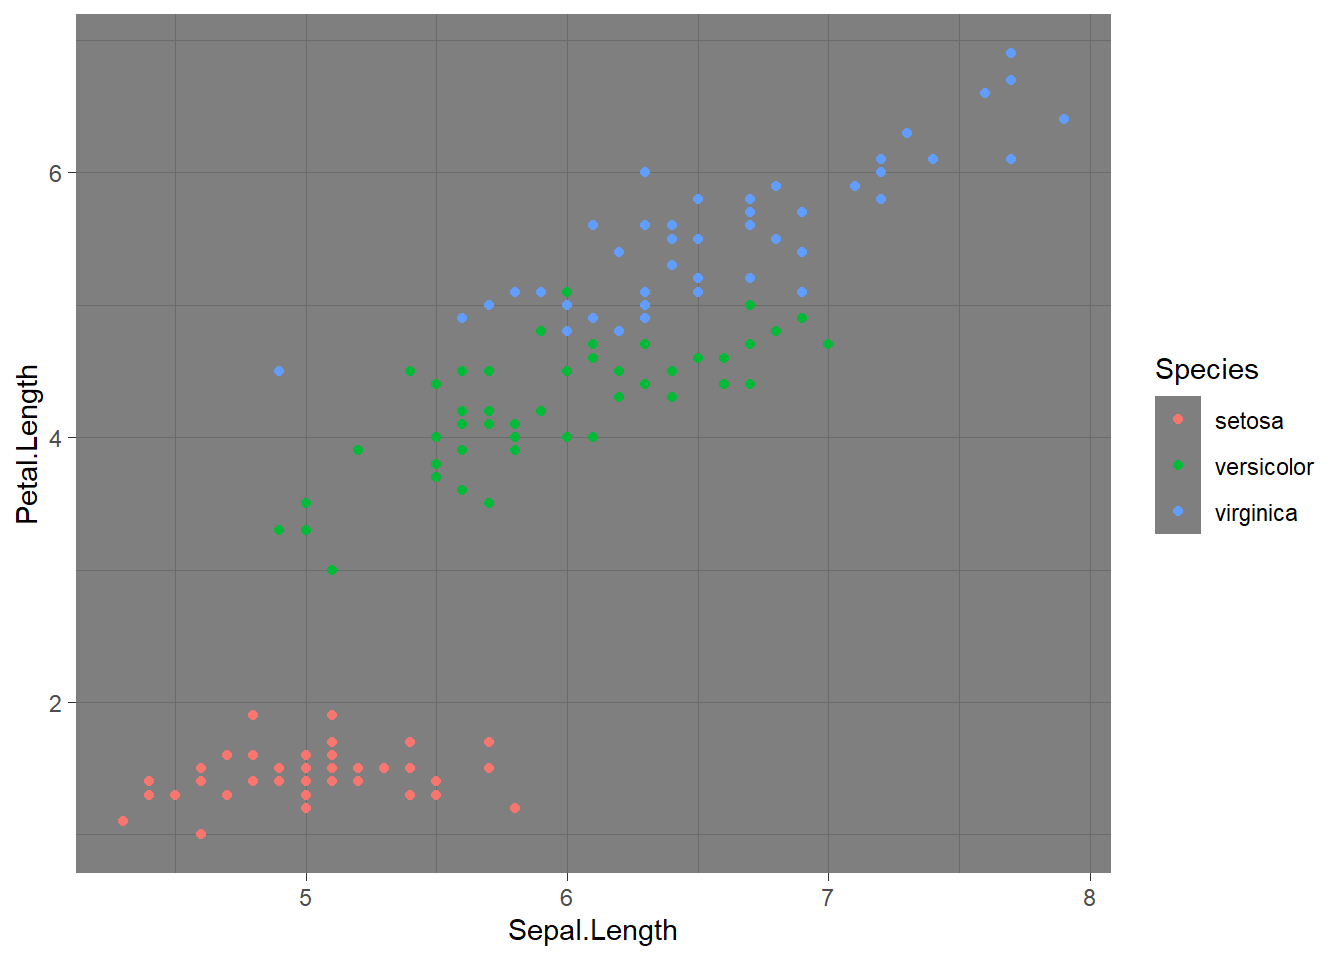
iris.scatter + theme_gray() # The default ggplot theme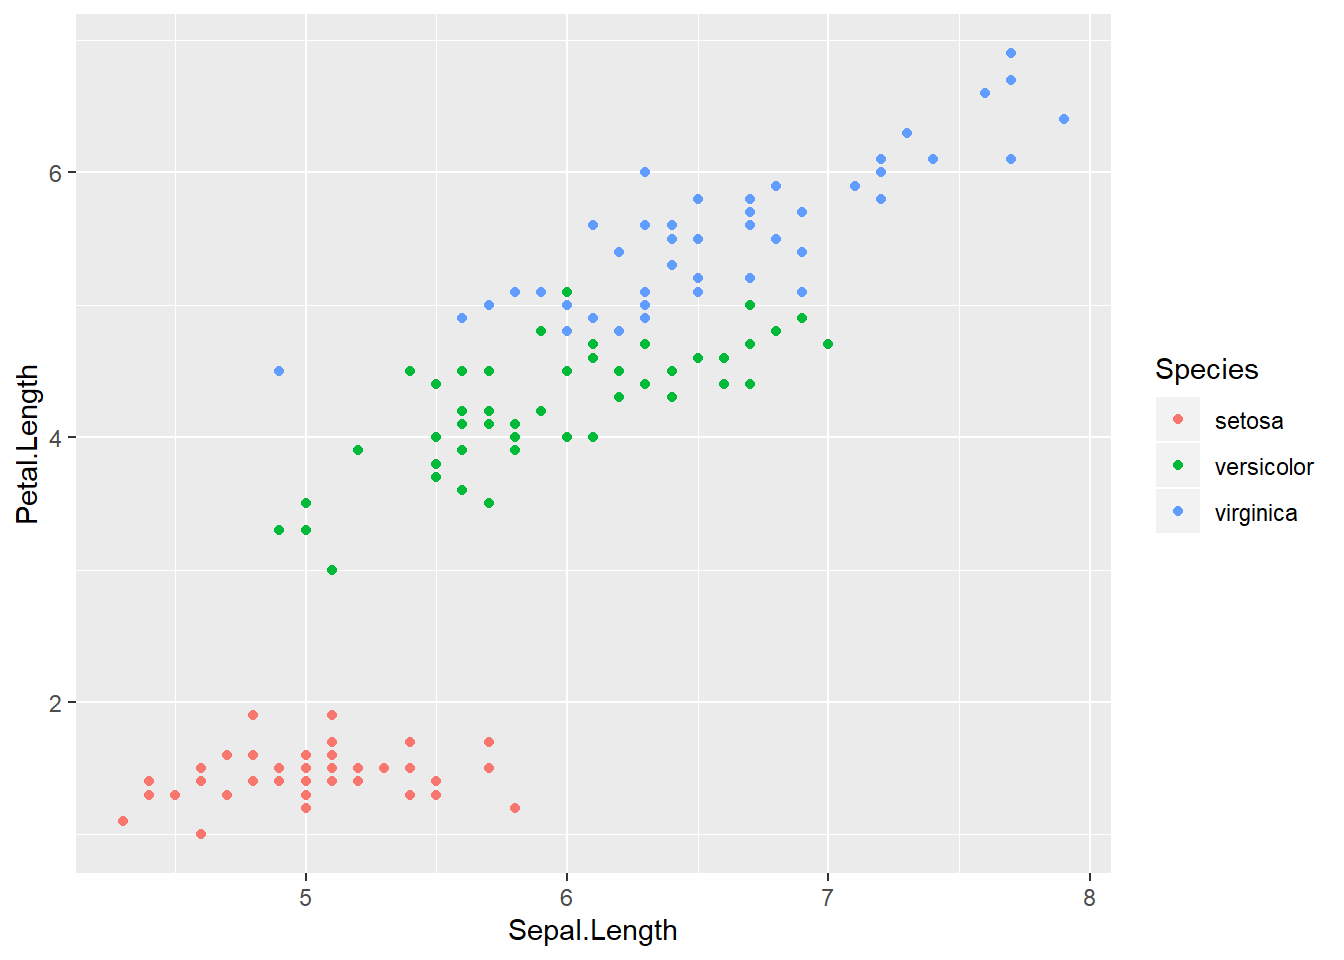
iris.scatter + theme_minimal()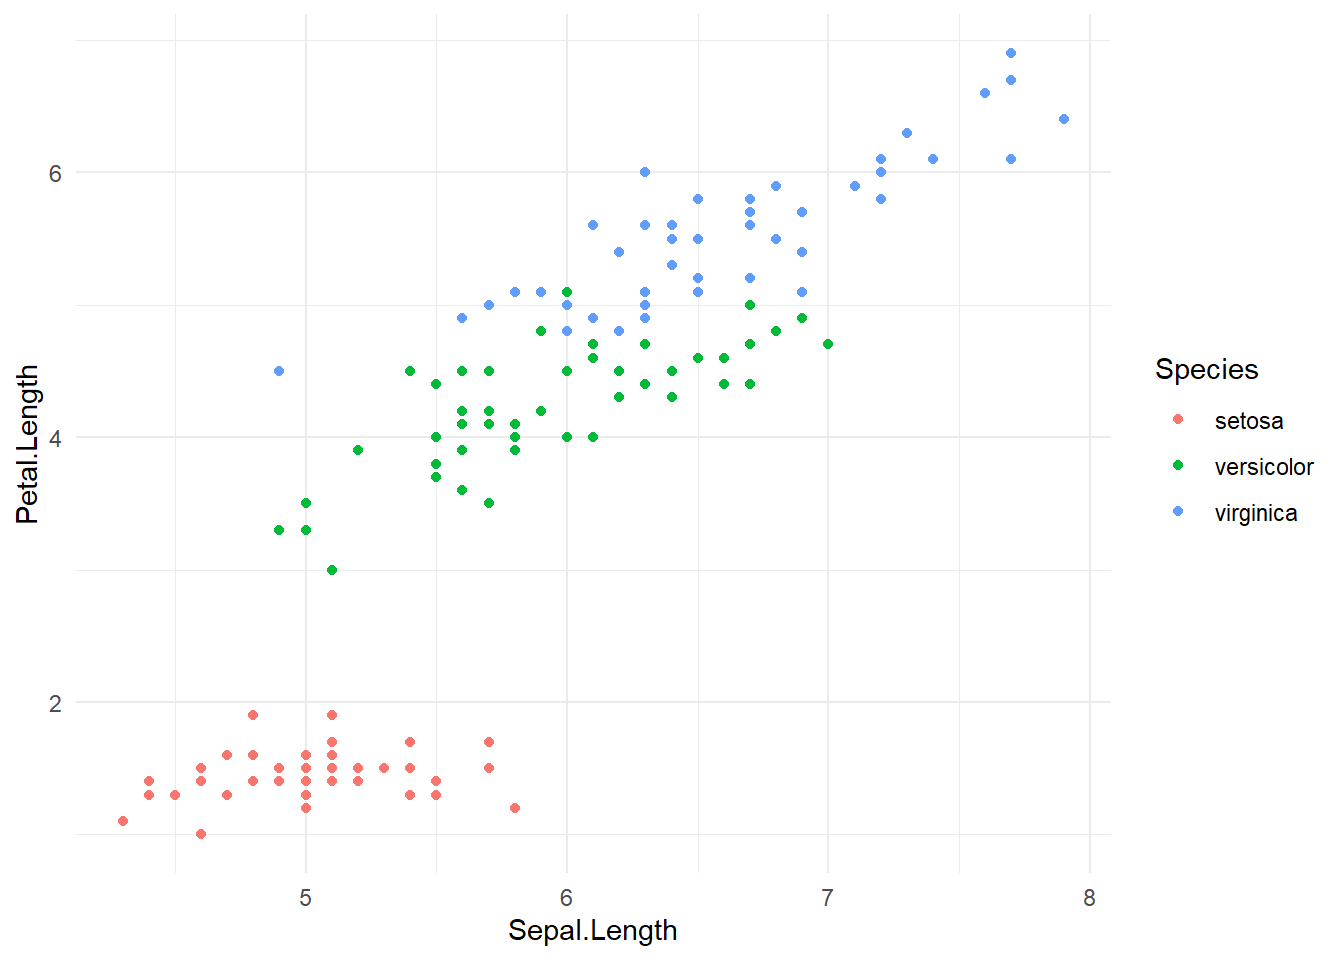
iris.scatter + theme_light()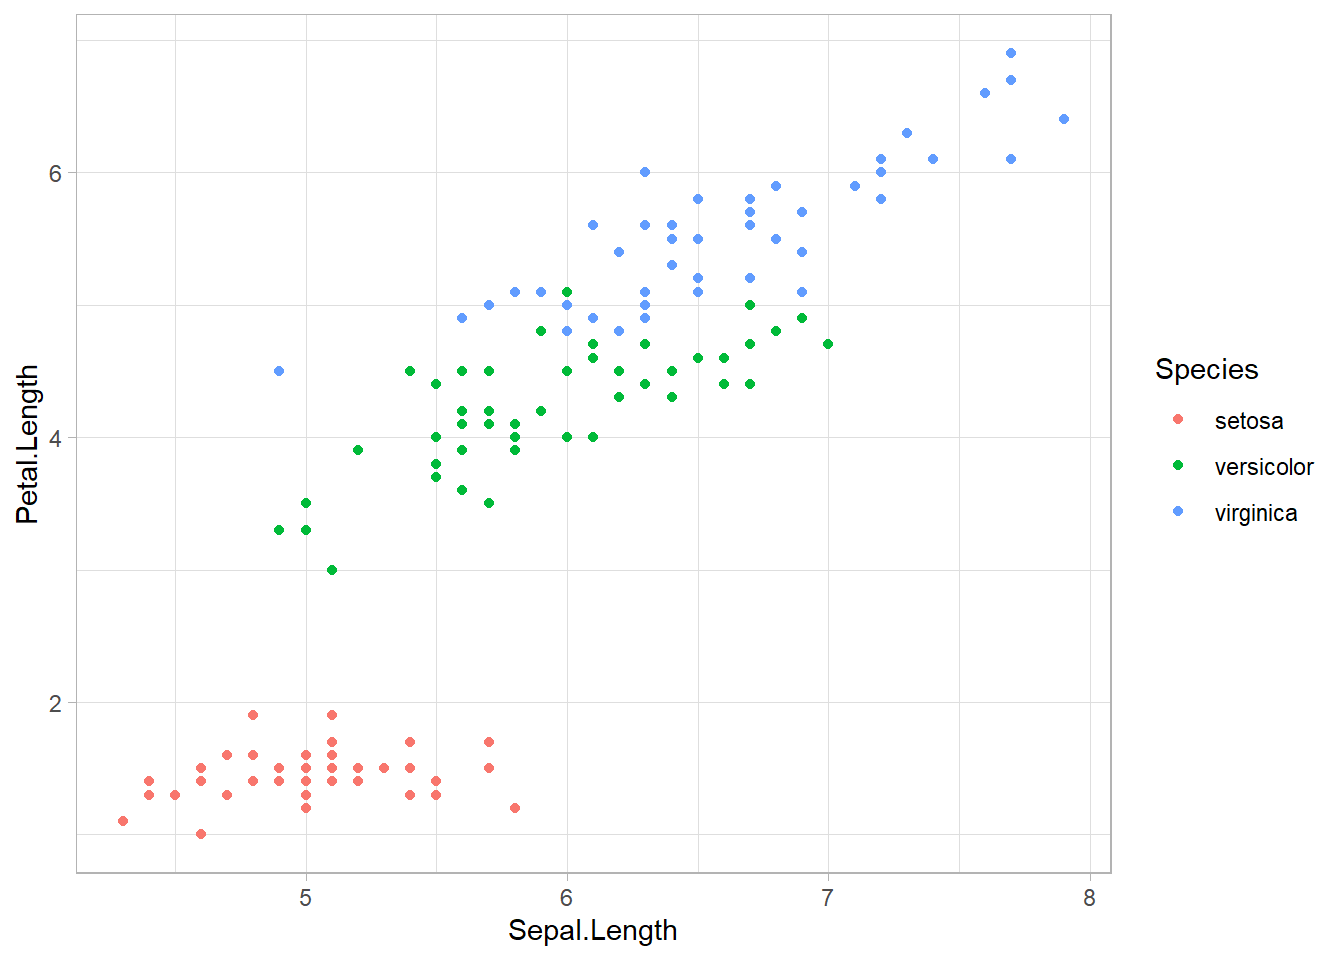
iris.scatter + theme_linedraw()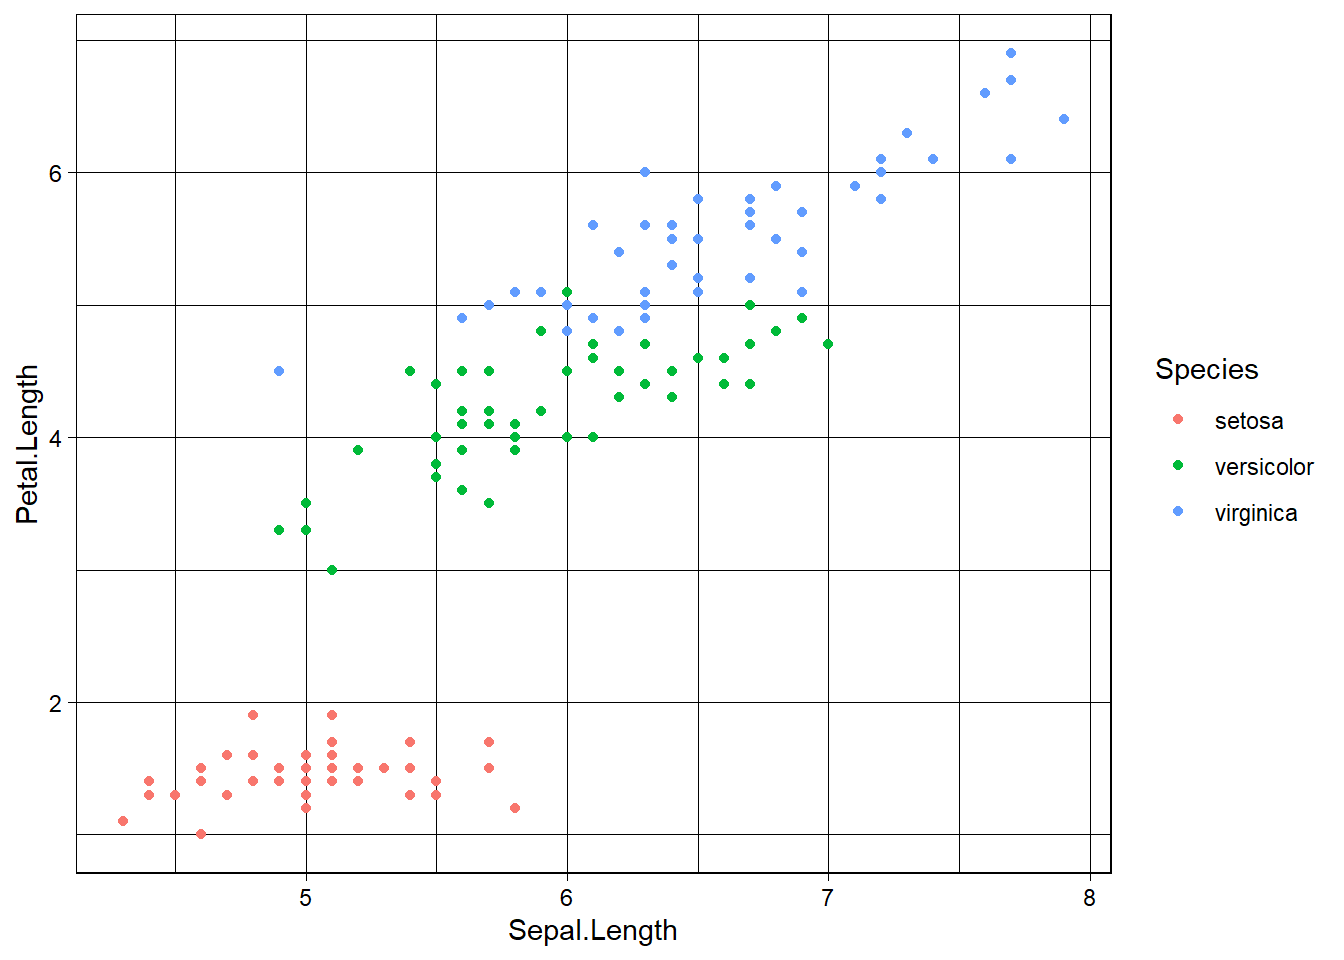
iris.scatter + theme_void()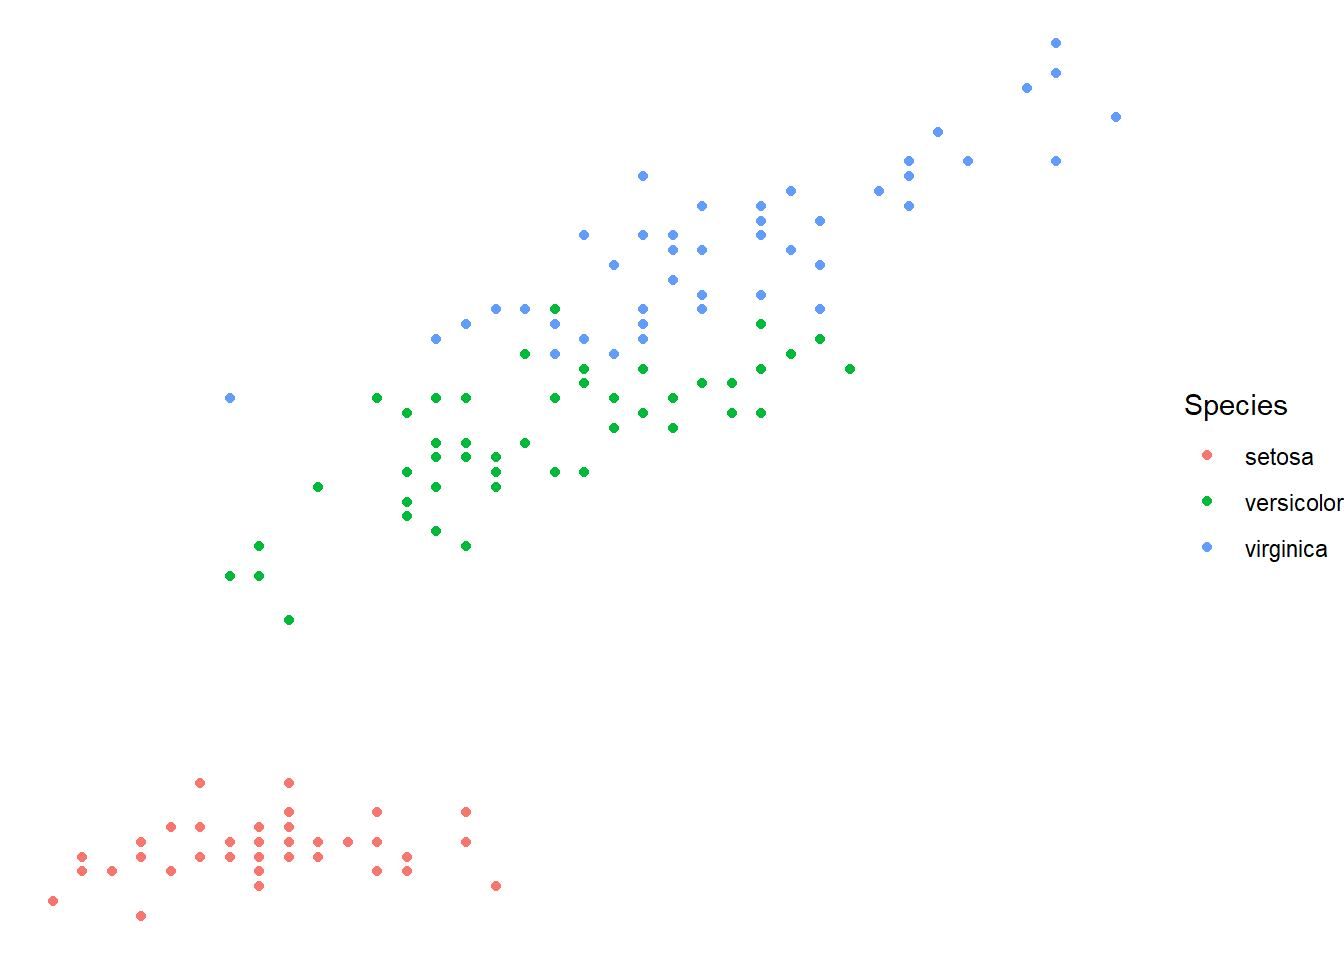
Pretty significant changes to the graphs appearance with little effort.
Of course, we can modify all the individual components of a theme without using one of the presets.
The best way to show this would be to look at the ?theme (help) window for this one. The general format for this is as follows.
iris.scatter <- ggplot(iris, aes(x=Sepal.Length, y=Petal.Length, colour=Species)) +
  geom_point() +
  theme(panel.grid.major = element_blank(), panel.grid.minor = element_blank(),  panel.background = element_blank(), axis.line = element_line(colour = "black")) +
  theme(axis.text.x = element_text(colour = "black", size = 12)) +
  theme(axis.text.y = element_text(colour = "black", size = 12)) +
  theme(plot.title = element_text(color="blue", size=12))

iris.scatter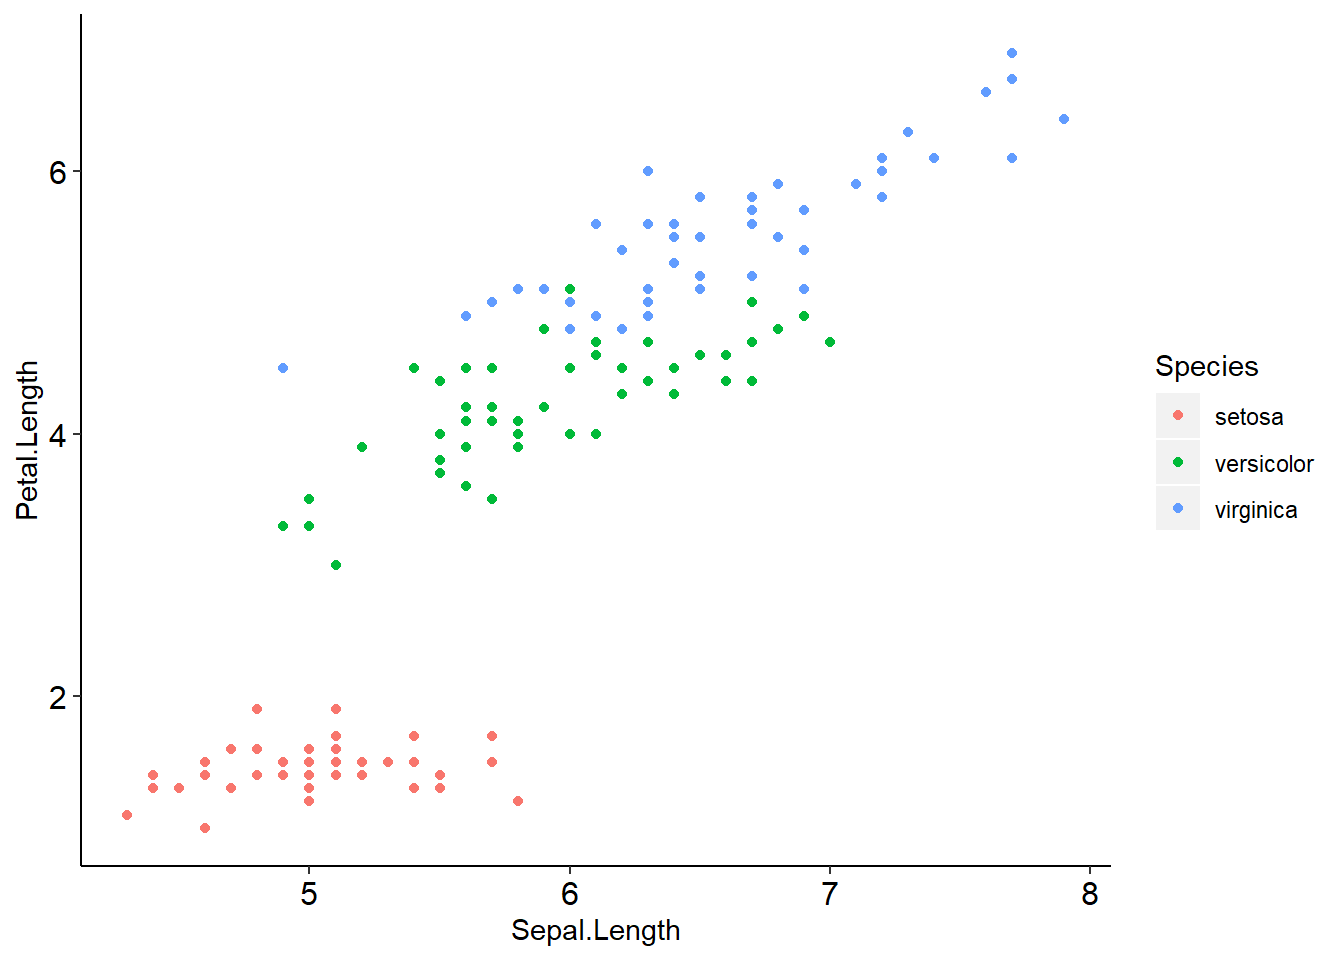
Within the theme() command, we simply call the feature we want to change, followed by how we want to change it.
For the panel grids and background, we call element_blank() to make it blank. Changing that to element_line() for the grids, and element_rect() for the background would change them to lines and rectangle, respectively. From there we could pick colour, size etc.
In the axis.text lines, we are setting the text colour to “black” and the font size to 12.
Now obviously, this is pretty daunting. But, you dont have to specify everything. You can very easily use one of the above preset themes (e.g. theme_minimal) and change one or two other things, such as axis line colour etc.
To save yourself writing all of the above theme() commands everytime you do a graph, you can save your favourite custom settings to its own object and add that to your graphs. Like so:
simpletheme <- theme(panel.grid.major = element_blank(), panel.grid.minor = element_blank(),  panel.background = element_blank(), axis.line = element_line(colour = "black"), axis.text.x = element_text(colour = "black", size = 12), axis.text.y = element_text(colour = "black", size = 12),plot.title = element_text(color="blue", size=12))

# We simply direct all of our theme arguments to an object

iris.scatter <- iris.scatter + simpletheme # then, just add that object to our graph
For example, let’s add those custom theme settings to our boxplot we generated earlier.
iris.box + simpletheme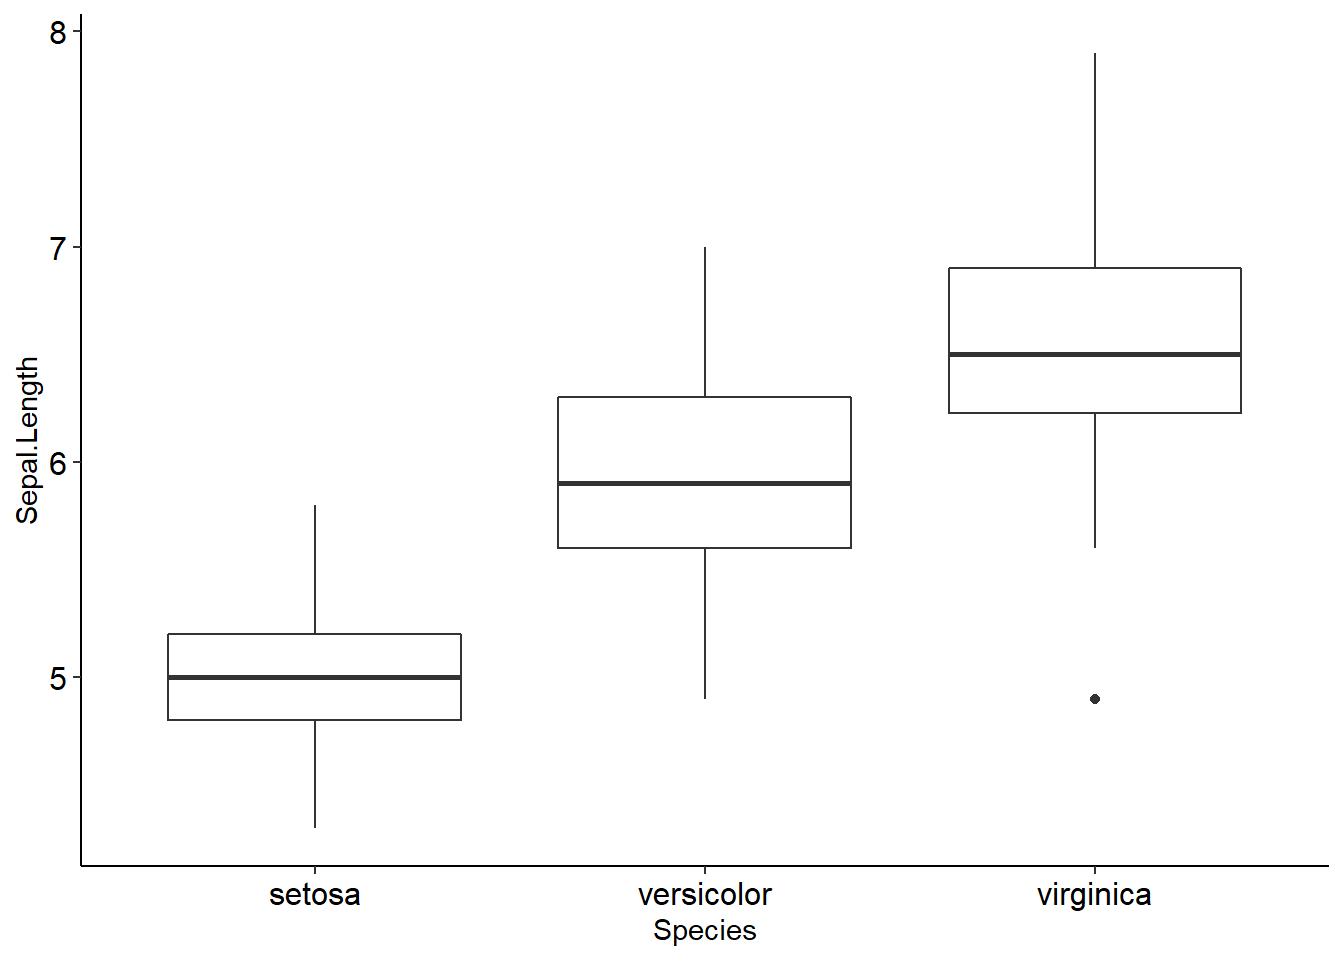
Ok, so that was alot of information that probably doesn’t make sense, so let’s break that down into its components.