Bar graphs - part 2
In the last examples, we plotted a single column graph with errorbars and significant notation. To plot multiple columns, for example a soil by species interaction, is quite simple.
Firstly, we will run our summarise command, adding the soil column into our group_by() command to generate the means and standard error for the soil, species combinations.
weeds.summarise2 <- weeds %>% group_by(species, soil) %>%
  summarise(mean = mean(flowers), se=sd(flowers)/sqrt(n()))
We plot multiple columns by specifying one column in our x axis, and filling/colouring by another. ggplot also plots our legend automatically, which is handy.
ggplot(weeds.summarise2, aes(x=soil, y=mean, fill=species)) +
  geom_bar(stat="identity")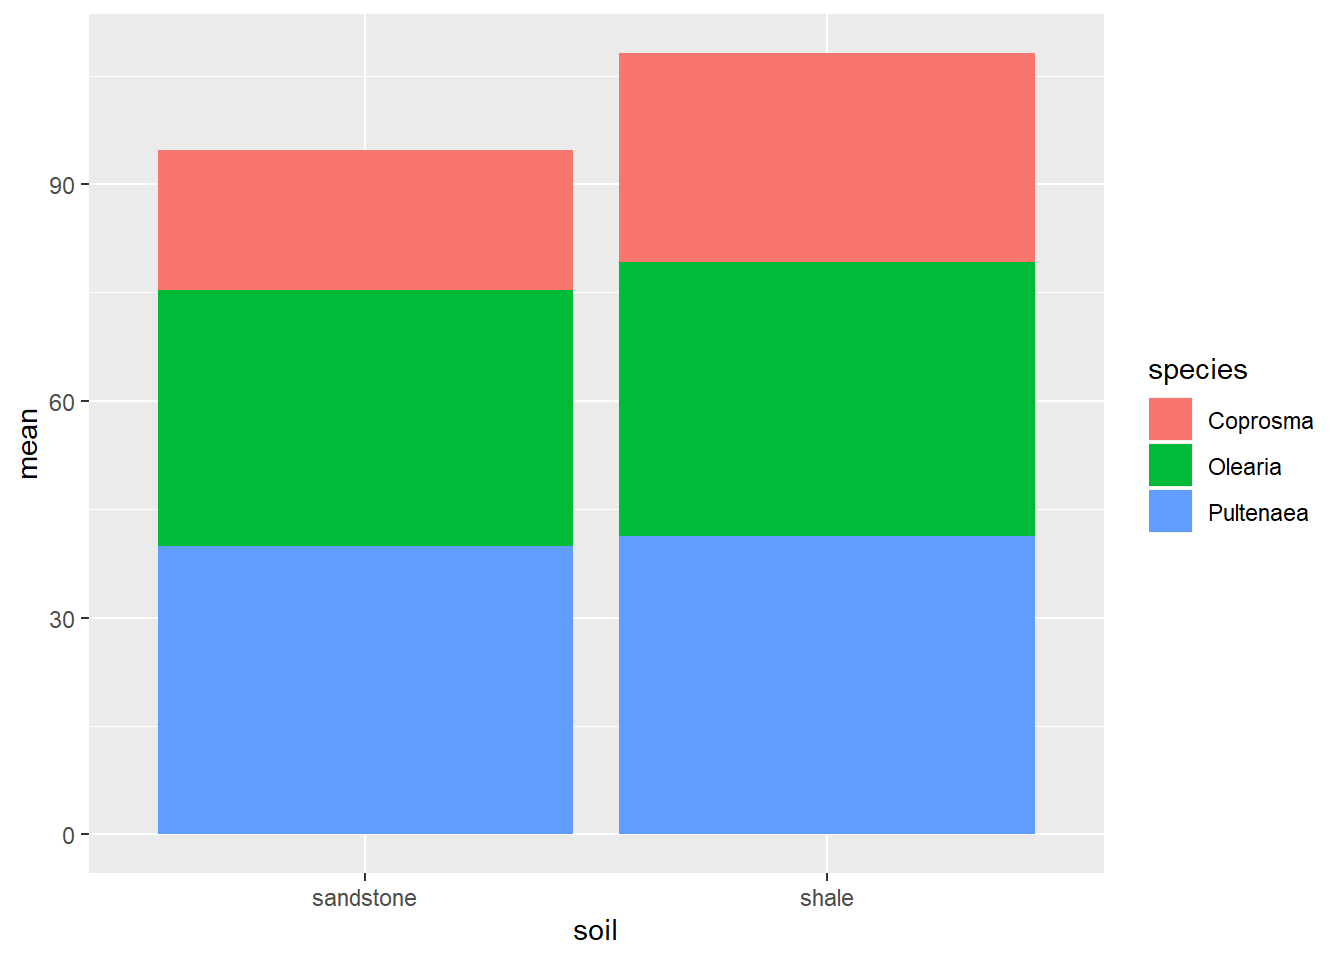
However, you can see the bar graph has stacked the species ontop of one another. To fix this, include the position="dodge" argument in your geom_bar(), like so.
ggplot(weeds.summarise2, aes(x=soil, y=mean, fill=species)) +
  geom_bar(stat="identity", position="dodge")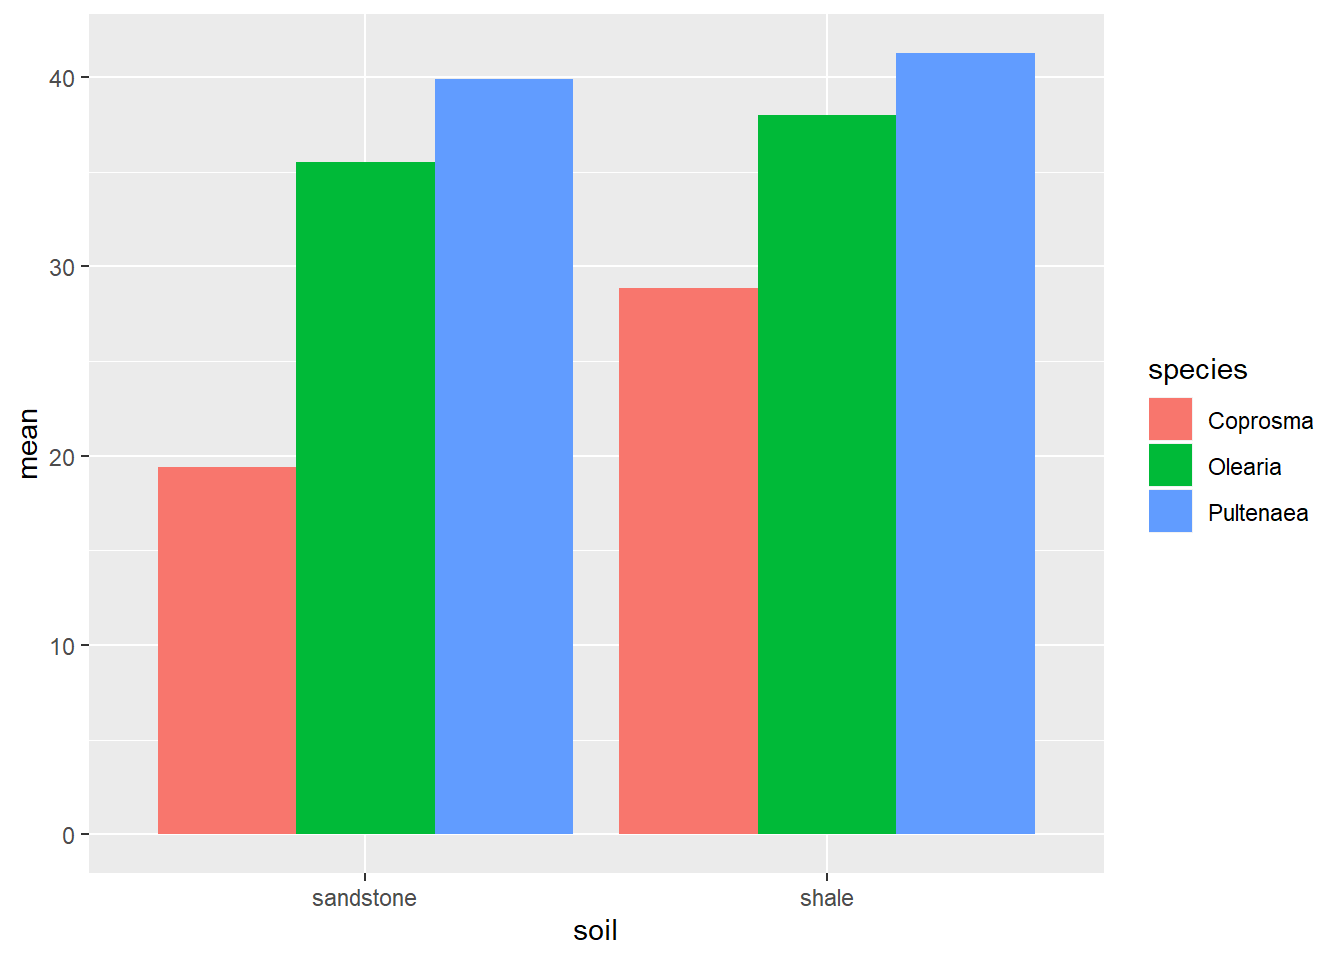
Horizontal bar graphs
Sometimes, a vertical bargraph just doesn’t cut it.
ggplot(weeds.summarise2, aes(x=soil, y=mean, fill=species)) +
  geom_bar(stat="identity", position="dodge")+
  coord_flip()
By using coord_flip() we can rotate the entire graph into its side, displaying our bar graph horizontally instead of vertically. This will work for pretty much every ggplot graph.
Errorbars
When plotting multiple errorbars, much like with standard bars, the default structure is to “stack” the bars in a single column. We can alter the position of errorbars through the use of the “position” argument.
Altering the position of errorbars in bar graphs has given me alot of headaches over the years. This gets more finicky the more complex your graph is, so I hope the below solution fixes all of your future problems :)
For this example, I am using our “interaction” bargraph to demonstrate.
ggplot(weeds.summarise2, aes(x=soil, y=mean, fill=species)) +
  geom_bar(stat="identity", position="dodge")+
  geom_errorbar(aes(ymin = mean-se, ymax = mean+se), width = 0.5, position=position_dodge(0.9))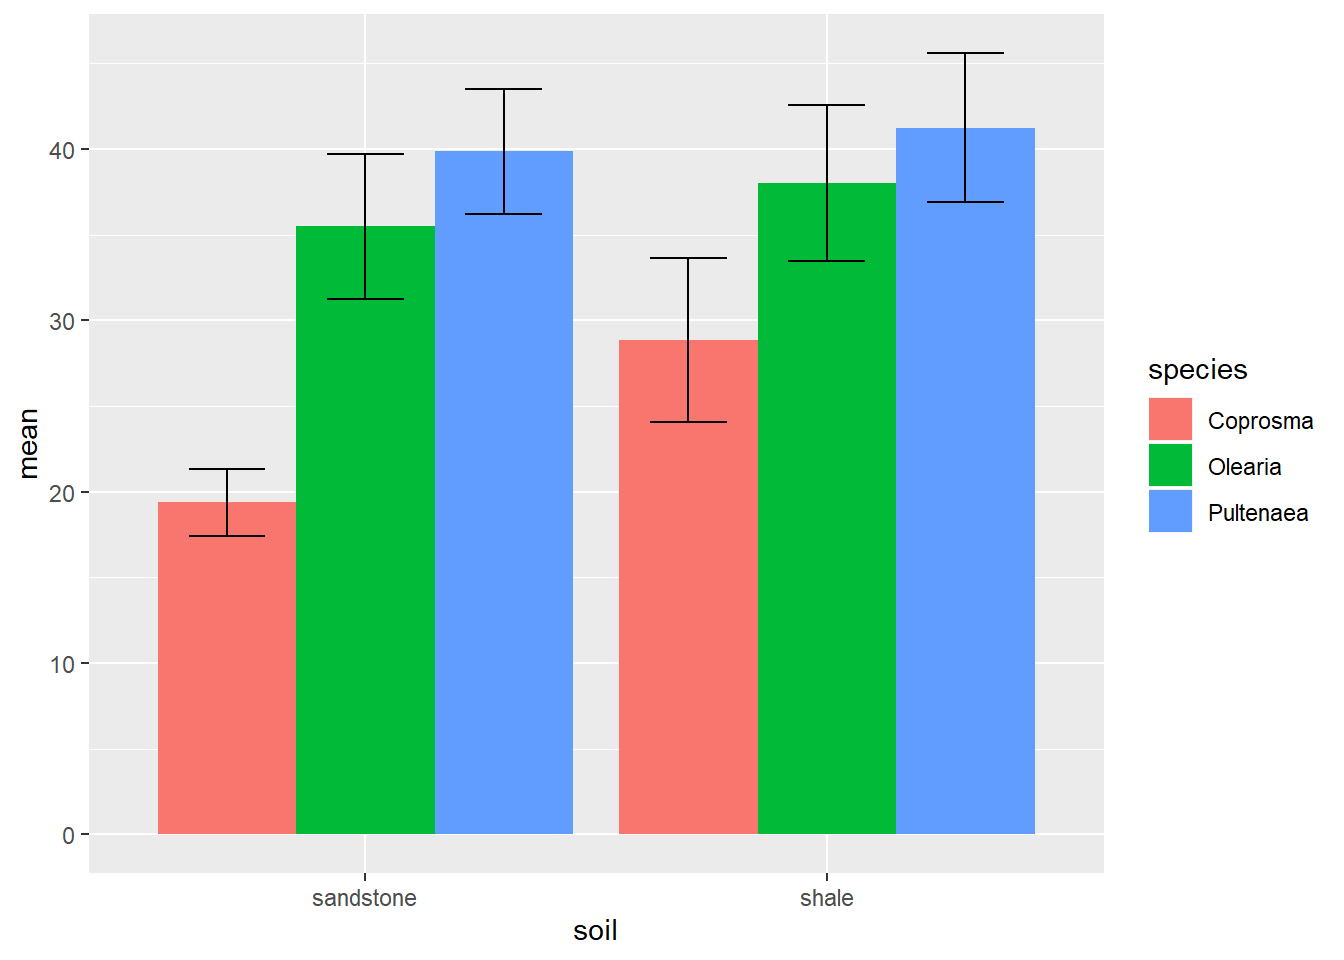
To alter the position of our errorbars we include the position=position_dodge(0.9) argument to match our original position="dodge" in our bar line. You will notice these two arguments have different values and syntax. The standard position="dodge" does work for the errorbars, but I have had very mixed results. The position=position_dodge(0.9) is slightly more annoying, but tends to work alot more. The 0.9 value is the default for the errorbars and refers to the distance between the middle errorbar and the left and/or right errobars when dodged. If your errobar comes out a little “funky”, modify this value.