Background
The plot and legend background colours can be changed using the following:
| Theme argument | Description |
|---|---|
| panel.background = element_rect(insert changes here) | This changes the background of the main plot itself. We need element_rect() as it is a rectangle geometric object. |
| legend.background = element_rect(insert changes here) | This will change the main area of the legend. |
| legend.key = element_rect(insert changes here) | This will change the small boxes that each of the factors levels are identified with. |
For all arguments, you can replace the element_rect(), element_line() etc. with element_blank() to remove it.
Within each of the element_rect() we can change various things. The most common ones are:
| Element argument | Description |
|---|---|
| fill = “colour” | This will change the overall colour of the object. |
| colour = “colour” | This will change the outline of the rectangle. |
| size = number | This will change the size/thickness of font and lines. |
Each of the “colour” arguments can be a specified a number of ways. The most common way is using one of the MANY predefined colours within R. A quick run down of these can be found here. For any of these, just put the name as it is spelt in that guide in quotations.
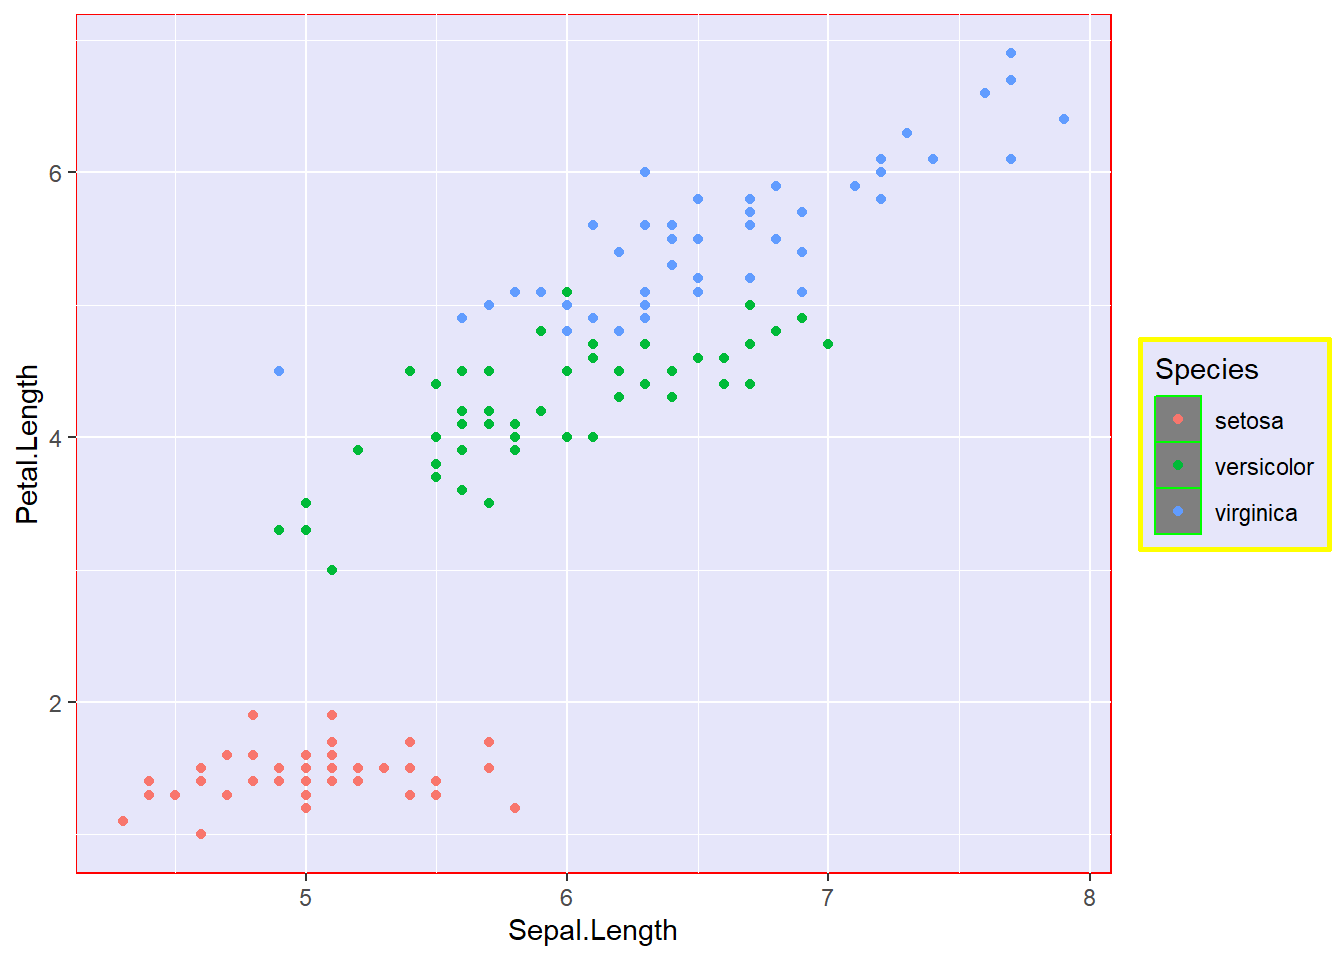
iris.scatter + theme(panel.background = element_rect(fill="lavender", colour="red"), legend.background = element_rect(fill="lavender", colour="yellow", size=1), legend.key = element_rect(fill = "gray50", colour = "green", size = 0.5))