Axis lines
To change the axis lines and ticks (lines above each number on an axis) use the following.
| Theme argument | Description |
|---|---|
| axis.line = element_line(insert changes here) | This will change both axes lines. |
| axis.line.x = element_line(insert changes here) | This will change just the x axis. |
| axis.line.y = element_line(insert changes here) | This will change just the y axis. |
| axis.ticks = element_line(insert changes here) | Change both axes ticks. Use the .x or .y to change just one axis at a time. |
| axis.ticks.length = element_line(insert changes here) | Change the length of the axes ticks. |
| axis.text = element_text(insert changes here) | Change the text on the axes TICKS. Use .x or .y to change just one. |
| axis.title = element_text(insert changes here) | Change the text on the axes LABELS/TITLES. Use .x or .y to change just one. |
| plot.title = element_text(insert changes here) | Change the plot title. |
Just use the colour and size arguments where appropriate. I am going to add these changes as a separate theme() command, but they can be added in the same command as last time.
iris.scatter + theme(panel.background = element_rect(fill="lavender", colour="red"), legend.background = element_rect(fill="lavender", colour="yellow", size=1), legend.key = element_rect(fill = "gray50", colour = "green", size = 0.5)) +
  theme(axis.line.x = element_line(colour = "skyblue", size=2), axis.line.y = element_line(colour="deeppink", size = 2), axis.title.x = element_text(colour="forestgreen", size=14), axis.title.y = element_text(colour = "gold", size=8), axis.ticks = element_blank())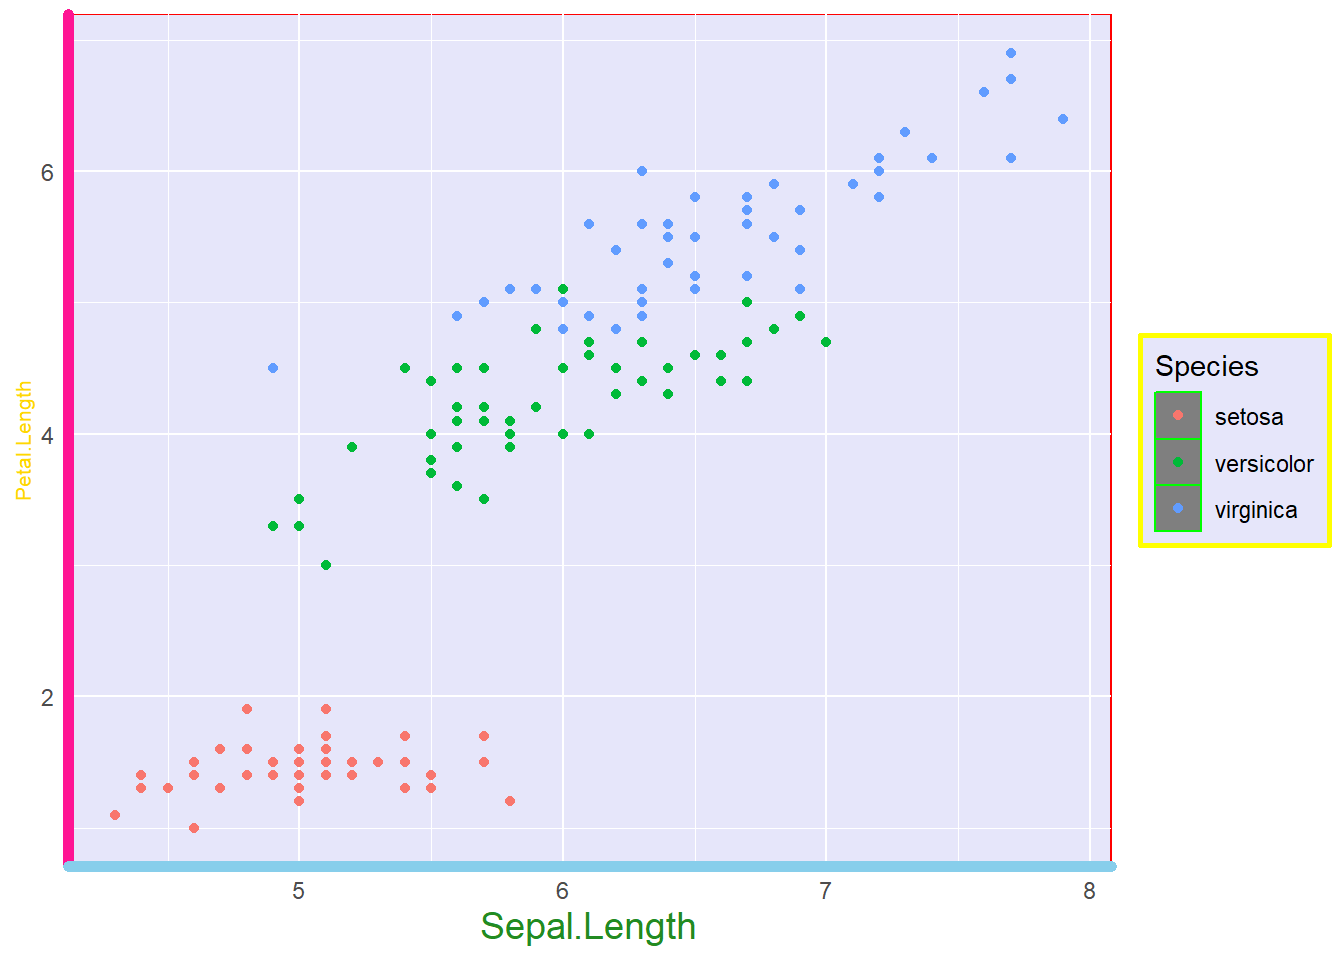
Beautiful, isn’t it?
Now you may have notice the size command acts differently for line and text. For line it is based on a multiplier of the original. So a 2 will be two times its normal size. Element_text() has size as a font size. So 2 would be tiny and equivalent to 2pt font. Alternatively, you can use size = rel(number) to scale the text relative to base R’s plotting size.